
 What trends in key financial planning indicators should we expect?
As wealth managers, we spend a lot of time working with our clients to structure their affairs to give them the best chance of achieving their desired financial futures. And we’re not just talking about structuring in terms of setting up self managed super funds, family trusts and the like. We’re talking about the structure and composition of their personal balance sheets. To us, this is the foundation of good financial planning.
We thought it would be interesting to look at the change in the financial position of the average Australian household over the past 20 years. Given the aging of the baby boomers over these two decades and their growing need to prepare for imminent retirement, we were surprised with what we found.
The data we used is highly aggregated and covers all working age groups, so it’s difficult to apply it to your specific situation. However, it does provide us with an idea of how the household sector is progressing as a whole.
There are at least three financial trends we would expect to see as a client approaches financial independence:
- The ratio of (net) financial wealth as a proportion of net worth increases, indicating an increasing proportion of wealth is being dedicated to securing financial security rather than to lifestyle assets;
- The ratio of borrowings to investment assets should fall, so that financial independence can be maintained without the use of excessive investment risk. Debt adds to financial risk and is inconsistent with investment strategies designed to withstand extremely adverse markets. This is a critical requirement for someone who can’t or doesn’t ever wish to return to the workforce; and
- The ratio of (net) financial wealth to annual (retirement) expenditure increases. Ideally, we like to see our clients accumulate financial wealth of at least 25 times their annual expected retirement spending to achieve financial independence.
The national financial planning trends are discouraging
The chart below shows how major components of household net worth have trended over the past 20 years.
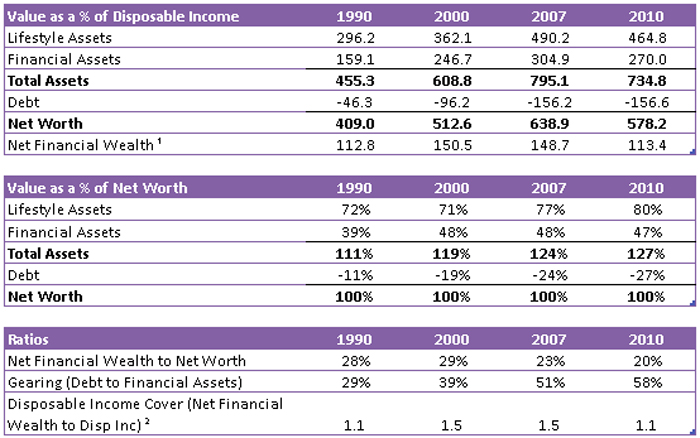
This chart data for particular years is shown in the tables below:
¹ Net Financial Wealth = Net Worth less Lifestyle Assets
² Reflects the number of times Net Financial Wealth covers Disposable Income. This is a similar measure to the ratio of Net Financial Wealth to annual (retirement) expenditure with Disposable Income being a multiple of annual expenditure.
On the asset side of the national household balance sheet, lifestyle assets have grown from 72% to 80% of net worth. This is predominantly made up of housing, which has grown from 63% to 76%.
Financial assets have increased from 39% to 47%, but have been largely financed by the growth of debt, that has risen from 11% of household net worth to 27%.
There was a noticeable shift of resources towards lifestyle assets from 2000. The ratio of net financial wealth to net worth shows a peak of 29% in 2000 with a gradual decline to the current 20% level in 2010. This is a fairly sizeable shift.
Debt has increased steadily over the period with the level of debt to financial assets doubling over the period (from 29% to 58%). Such an increase in household gearing (or leverage) is the exact opposite of what we would have predicted as the baby boom bulge approaches retirement. Because of the increased leverage, household net worth (or wealth) is now potentially more, rather than less, volatile.
The ratio of net financial assets to disposable income has remained flat (at 1.1 times). We would have expected this to increase simply as a result of the baby boomers moving to the peak of their financial wealth.
We have included the 2007 year (in which net worth peaked) to show the impact of a pre and post GFC position. Interestingly, debt is continuing its upward trend. Net financial wealth is 24% below that of the 2007 peak (when measured as a percentage of disposable income).
Household balance sheets have deteriorated
The analysis above suggests that household balance sheets are becoming more highly geared. This suggests considerably reduced capacity to cope with major negative shocks. There has also been a sizable increase in lifestyle assets. This can only make financial independence more difficult to attain and the lack of improvement in (net) financial assets as a multiple of disposable income is particularly discouraging given the expected increase from the “baby boomer” effect.
It would appear that at some stage there will need to be a reversal of the shift to lifestyle (housing) assets. The question is – which part of the household sector has the financial resources to fund this exit from lifestyle assets?
We believe there is a need to be more strategic about shaping your balance sheet, if financial independence is your aim. The trends of the past 20 years reflect conventional wisdom, particularly the views of “my home is my retirement strategy” and borrowing is an effective way to accumulate wealth.
These are naïve strategies. They are highly risky and expose their adherents to potentially devastating consequences if property markets turn really sour.
There are smarter and much less risky ways to secure your financial future. We encourage you to look at the progress of our clients as evidence that a long term strategic approach to financial planning that defies national trends can achieve outstanding results.
——————————————————————————————–
Data taken or derived from RBA Statistical tables B20, “Selected assets and liabilities of the Private Non-financial Sectors” and B21, “Household Finances – Selected Ratios” Covers the period from December 1990 to December 2010.
Net financial wealth is your “non-lifestyle” asset wealth and is calculated by deducting your lifestyle assets from your net worth.


