


Is history a reliable guide to future investment returns?
When doing long term cash flow projections for clients, it is necessary to make some “guesses” of future investment returns. Unfortunately, for the 50 year cash flow projections we do, the results are very sensitive to these guesses.
If they prove too high, without any adjustments along the way clients may end up in a considerably worse financial position than projected while, if too low, they may have led unduly financially constrained lifestyles. The antidote, of course, is to regularly review the projections, ideally annually, and make regular small adjustments rather than put an initial Plan in the drawer and see how things turn out in 50 years’ time.
For many years our key projected investment returns have essentially been 1% p.a. for cash and 5% p.a. for shares, both after-inflation and before-tax. A 4% p.a. risk premium for investing in shares is implied. The long term historical experience (from January 1926) of the US stock market shown in the chart below reveals an actual 0.4% p.a. return for cash, 7.0% p.a. for shares (i.e. equities) and a 6.6% p.a. risk premium, suggesting our share return and risk premium projections are “conservative”.
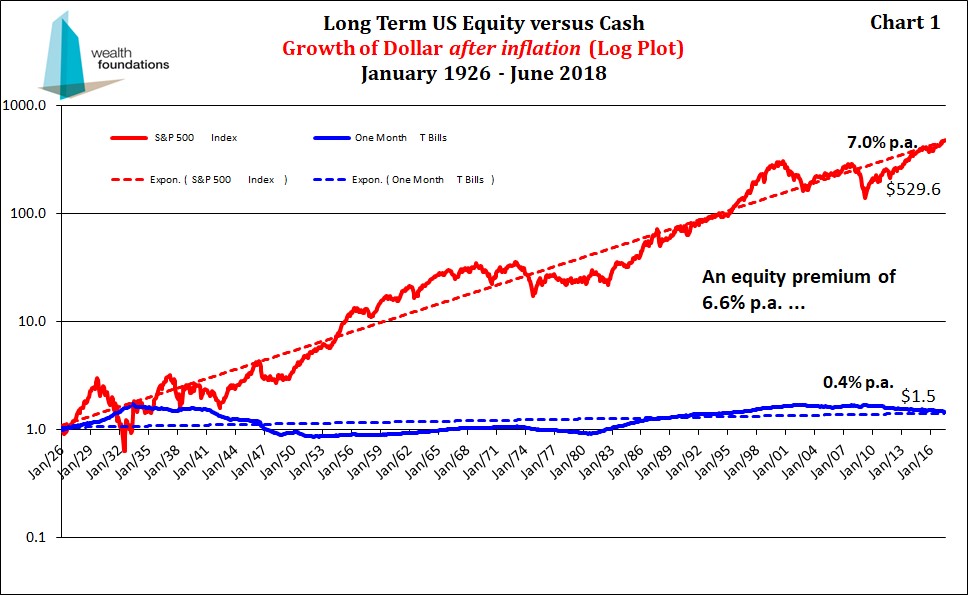
But as most investors probably know, at least intuitively, the last 20 years indicate that while long term historical returns may provide some useful information, you could be very disappointed if your financial plan was based on that history. The rest of the article examines actual cash and share returns, relative to our projections, since 1980.
Recent Australian investment returns don’t look at all like the long-term US experience
The chart below shows 20 year rolling after-inflation returns for shares[1] since December 1979. 20 years is used as an estimate of the length of time investors have available to seriously commit to accumulating investment wealth prior to retirement.
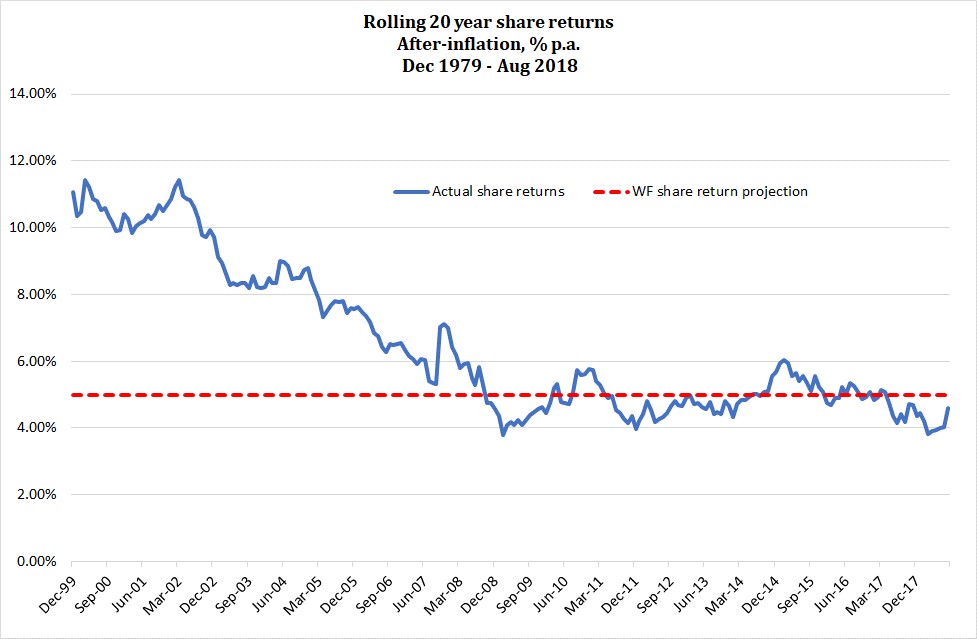
Clearly, the range of returns is large, with returns above (often, well above) our 5% p.a. projection until about the 20 years to September 2008. Beyond that, returns have oscillated around the 5% projection, with some significant undershoots (e.g. the 20 years to February 2009 at 3.78% p.a.).
The following chart reveals what this range of returns means in actual $ terms, showing the 20 year rolling returns converted to the after-inflation growth after 20 years of an initial investment of $1.
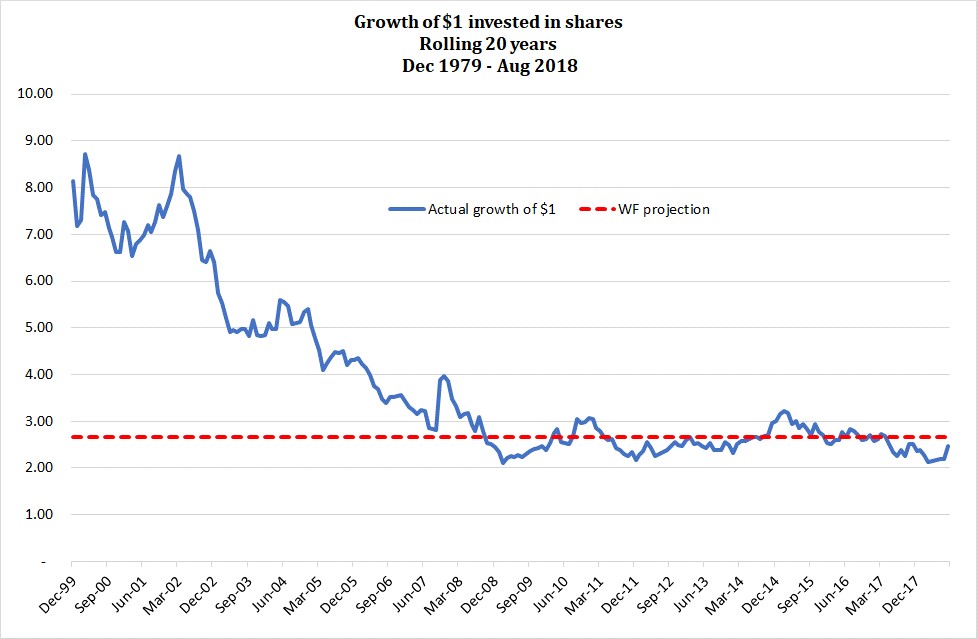
It indicates that a share investor who invested $1 million in March 1980 would have seen it grow to $8.7 million by March 2000, while someone who invested $1 million 9 years later, in February 1989, would have accumulated $2.1 million by February 2009. Needless to say, these are very large variations in investment wealth, with significant lifestyle implications, purely due to when the initial investment was made.
The following chart shows the 20 year rolling after-inflation returns to cash[1] since December 1979, compared with our cash projection.
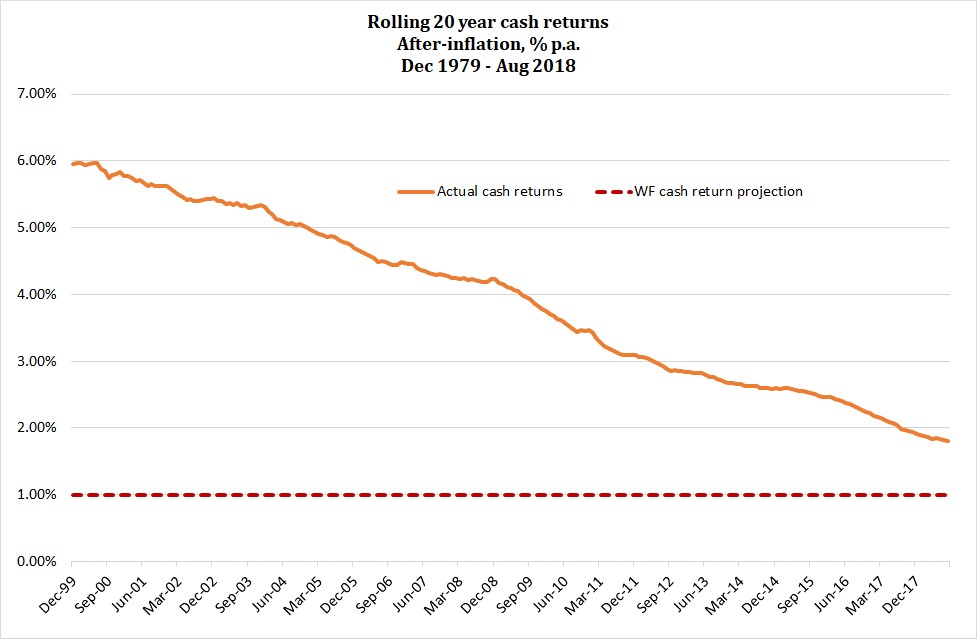
The incredible 6% p.a. returns of those who invested for 20 years from December 1979 have since slid inexorably towards what we believe is a much more sustainable 1.0% p.a. and consistent with the long-term US experience. Many Australian retirees are still adjusting to the realisation that 3-4% p.a. returns above inflation for, essentially, a risk-free investment were more likely an anomaly rather than the norm.
The final chart below examines the rolling 20-year risk premium experience since December 1999 i.e. the additional return from investing in risky shares compared with risk-free cash.
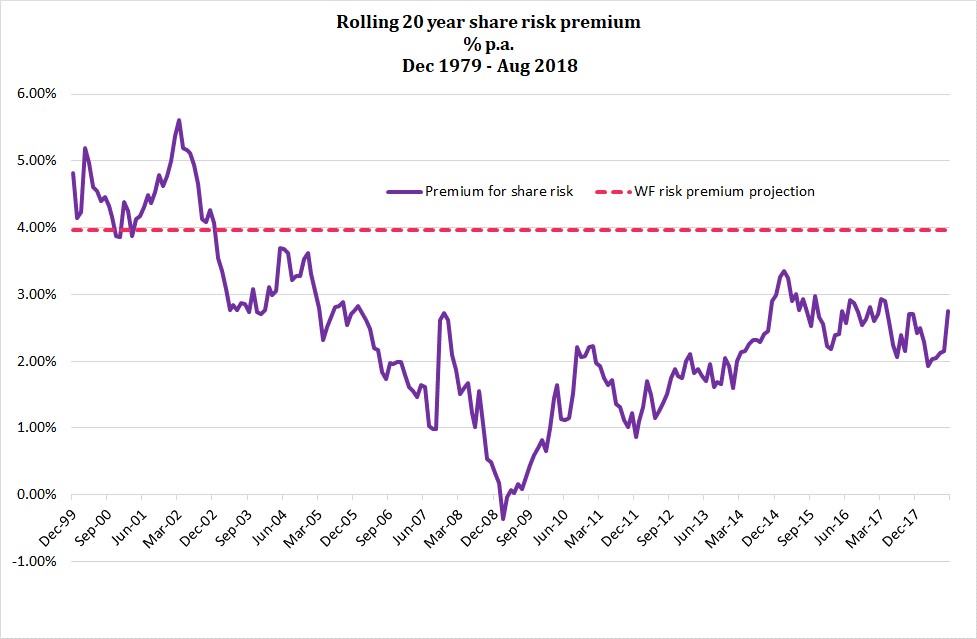
It reveals that the risk premium has rarely been above our 4% p.a. projection and was consistently well below the long-term US experience of about 6.6% p.a. In fact, for the 20 years to March 2009, there was no premium for investing in shares in preference to cash – unsustainably high cash rates and the bottom of the Global Financial Crisis explain this rare occurrence. Share market recovery and falling cash rates have subsequently seen the risk premium increase but it remains below our projection of 4% p.a.
Don’t rely on investment returns to achieve your financial future
The analysis highlights that investment returns can vary significantly and for long periods of time. Even if the US long term experience proves to be a good guide to future long term investment returns, your lifetime investment return experience may bear no resemblance. That’s why our financial planning focus isn’t on investment returns – they are primarily market driven and out of your (and our) control.
The key to achieving the financial future you want is to focus on the things you can, to a greater or lesser extent, control, including:
- the amount of investment risk you are comfortable with;
- the efficient structuring of that risk;
- your investment market entry/exit strategy;
- your investment costs and personal spending; and
- your ability to generate income.
And, as your circumstances change and investment outcomes are revealed, make regular adjustments to your expectations to reflect the new reality.
[1] An indexed share portfolio, comprising 50% Australian shares and 50% unhedged international shares.
[2] As measured by the Bloomberg AusBond BankBill Index
