

The share market “news” you’re hearing may be misleading
The four months to 31 December 2018 saw a nasty fall in both Australian and global share markets. As measured by the S&P/ASX200 Price Index, the Australian share market fell 11.3% over this period. At an end December 2018 level of 5,646.40, financial commentators couldn’t help themselves adding to the gloom by noting that the index was 15.7% below the all-time high of 6,700.6, recorded on 26 October 2007.
The implication is that the Australian share market was still well below pre-Global Financial Crisis (“GFC”) levels, despite the passage of over 11 years. A further conclusion that might be implied is that the share market isn’t a great place to invest. While not claiming the past 11 years has been the best experience for investors, the focus on the 26 October 2007 S&P/ASX200 Price Index peak as a benchmark is potentially misleading, for at least two reasons:
- The peak may have represented an extraordinary level, rather than what could be considered “normal”; and
- The “Price” index doesn’t measure the total return from share investing, capturing only changes in the prices of shares and completely ignoring the impact of dividends.
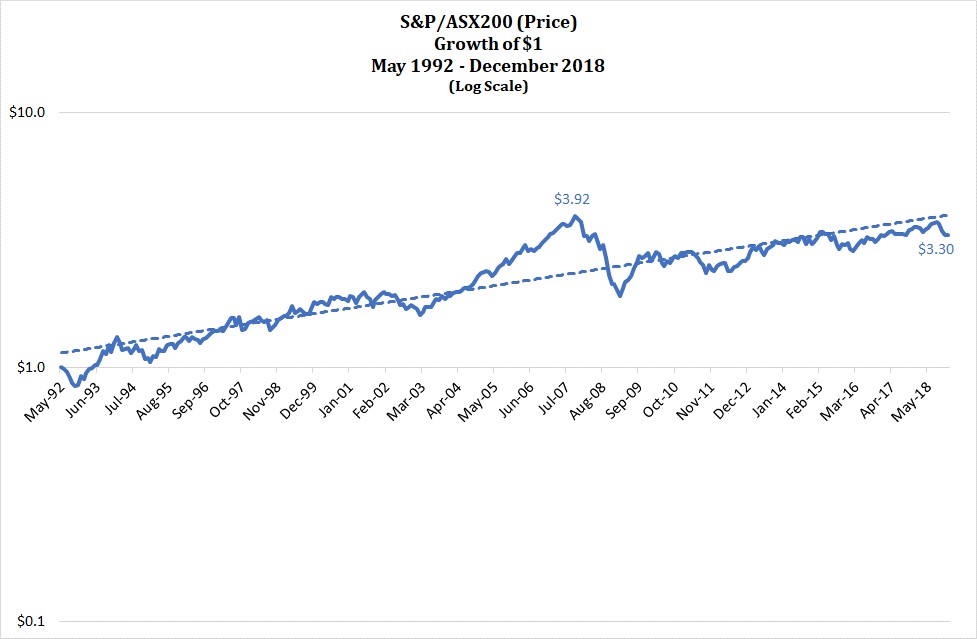
With regard to the peak level of the Price index, the following chart shows that from about March 2003 to October 2007 the index grew well above the trend for the period examined (i.e. the dashed blue line). With the benefit of hindsight, the October 2007 pre-GFC peak appears the anomaly rather than the end December 2018 level, that was a little below trend.
However, Australian share market performance can’t begin to be assessed without taking into account the contribution of dividends to total return. The rest of the article examines the recent and longer term total return performance of the Australian share market, highlighting the historical importance of dividends.
Total share returns comprise dividends and changes in value
The total annual pre-tax return for an investment (e.g. share, investment property, term deposit) comprises any income provided by the investment (e.g. dividends, rent, interest) plus the change in its value over the year, less any associated holding costs. So, to measure the annual total return for the share market, ignoring any costs, requires adding the total dividends paid by all companies listed on the share market that year to the total changes in the prices of those shares over the year.
In order to create an index of total share market returns beyond a year, it is necessary to make an assumption regarding the investment of dividends paid. For the calculation of the S&P/ASX200 (Total Return) index, measuring the total return of the largest 200 companies on the Australian share market, it is assumed that each company’s dividends are reinvested in that company at the time the dividends are payable to shareholders.
The chart below shows the growth of an initial investment of $1 based both on the S&P/ASX200 Total Return and Price (as charted above) indices for the period from May 1992 to December 2018, together with trend lines for each index.
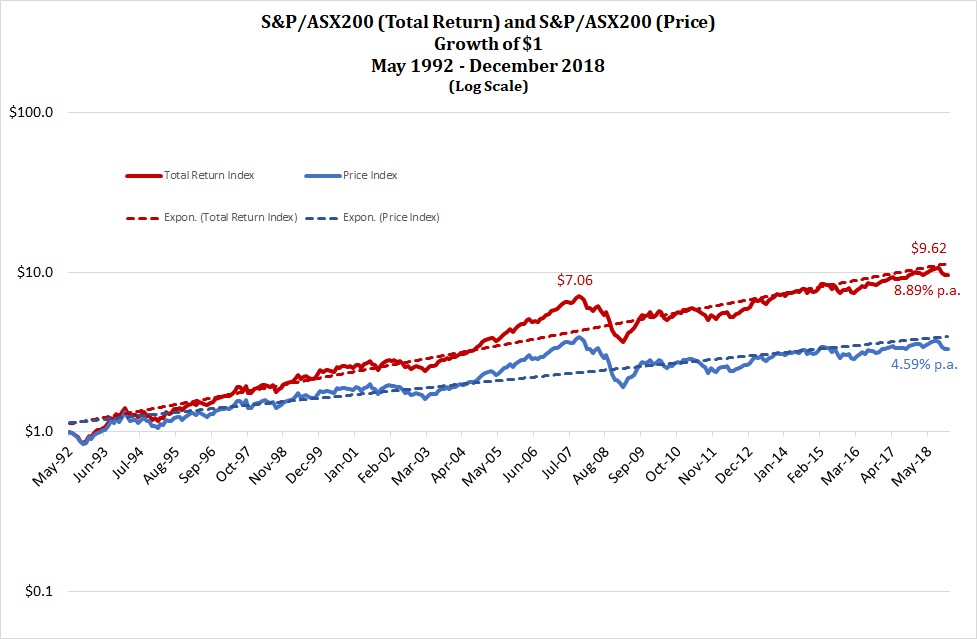
The Total Return chart story is very different to that of the Price chart. The end-December 2018 Total Return measure is 36% higher than the pre-GFC peak, rather than continuing to languish below as is the case for the Price Index. The Total Return Index gained all the ground it lost through the GFC by October 2013.
From the bottom of the GFC in February 2009, the Total Return Index increased by 264%, while the price index rose by 173%. These represent annualised growth rates of 10.4% and 5.7%, respectively, both indices’ performance roughly equating to their longer-term trends.
The importance of dividends as a component of return is highlighted by the difference in annualised returns for the indices for the entire period – 8.89% p.a. for the Total Return Index and 4.59% p.a. for the Price Index. The difference of 4.30% p.a. reflects dividends payments and the assumed reinvestment of those dividends.
The following chart reveals the annual contributions (i.e. dividends and price changes) to total return for the period May 1992 to December 2018:
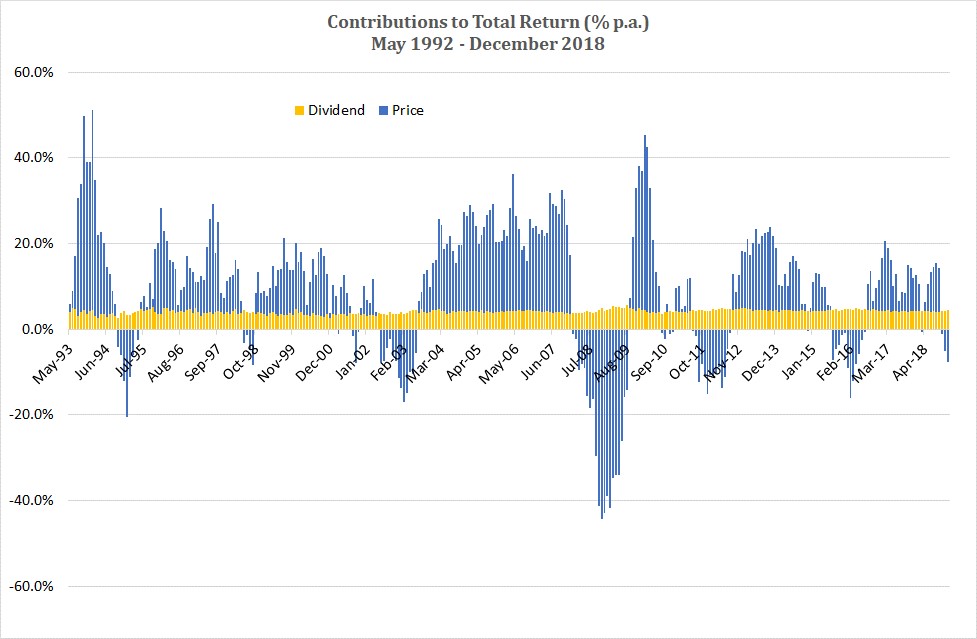
Dividends contributed an average 4.1% to total annual return, with relatively little variation, while price change contributed a higher annual average of 6.4%, but with headline creating volatility (that significantly reduces compound annualised returns for the entire period).
There’s more to share market performance than changes in values
The message is that it is total returns that matter when assessing investment performance, rather than simply changes in value. In fact, to be more accurate, it is total returns, after taxes, costs and inflation, for risk taken, that you should be concerned about. But that is a considerably more complex story.
However, given the relatively high (e.g. compared with the US) levels of dividend payments made by Australian companies and the fact that over the past almost 30 years these dividend payments have accounted for about half of the Australian share market’s total return, it makes you wonder why any attention is paid to the Price Index at all. But, unfortunately, it is the most conveniently available measure of share market performance and makes for some good (but misleading) sound bites in the evening news. Boring, regular dividend payments don’t rate.
