Every picture tells a story...
Below we present a number of charts that illustrate aspects of investment that have been discussed in detail elsewhere on this site. Historical data is presented, not as a basis for predicting future investment returns, but as support for the investment principles discussed in “Foundations of Financial Economics”. The charts are updated annually at 30 June of each year, as soon as data is available.
The rationale for taking investment risk...
The adjacent chart (Chart 1) reveals that since January 1926 in the US there has been a significant reward for taking equity or share risk compared with investing in cash – an equity premium of 6.6% p.a. Over extended periods, there was a large opportunity cost to remaining in cash rather than equities. But:
before the S&P500 index finally reached its previous peak of March 2000.

The message: As long as capitalism remains robust it can be expected that there will continue to be a premium for taking equity risk. But this premium will only be reliably available to the patient.
How has the Australian share market done over the long term?
We don’t have reliable share market data comparable to the US back to 1926. Chart 2, opposite, shows in local currency terms the comparable performance of large US and Australian shares since end 1979. To 30 June 2018, despite some significant divergences at various times over the period, the whole of period returns vary by 0.6% p.a.
Which market will do best in the future? Given the efficiency of international share markets, we believe any forecast is simply a guess. But we also believe that international share market returns will not move in tandem with the Australian share market and there will continue to be diversification benefits from investing in international shares.
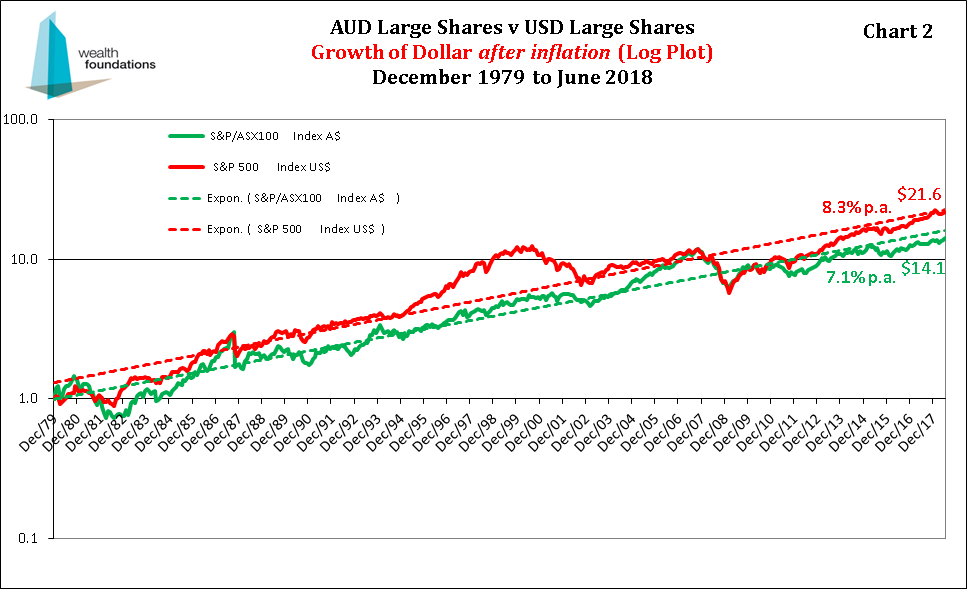
The message: There is no reason to expect the Australian share market to outperform international share markets. While domestic shares may offer the emotional benefit of familiarity, an overweighting is likely to increase portfolio volatility without any expected return.
Investing in growth assets is a risky business
The growth asset classes of Australian shares, international shares and listed property outperformed the defensive asset class of cash (i.e. bank bills) over the period December 1981 to June 2018, as shown in Chart 3 opposite.
But the growth asset class ride has been rocky. And most investors’ experience is not to invest all their funds at a point in time, reinvest distributions, and watch what happens for the next 35 plus years. Depending on when you invest, your perception of the merits of investing in the growth asset classes may be somewhat different.
The table below shows the after-inflation returns of the main asset classes over various periods to 30 June 2018:
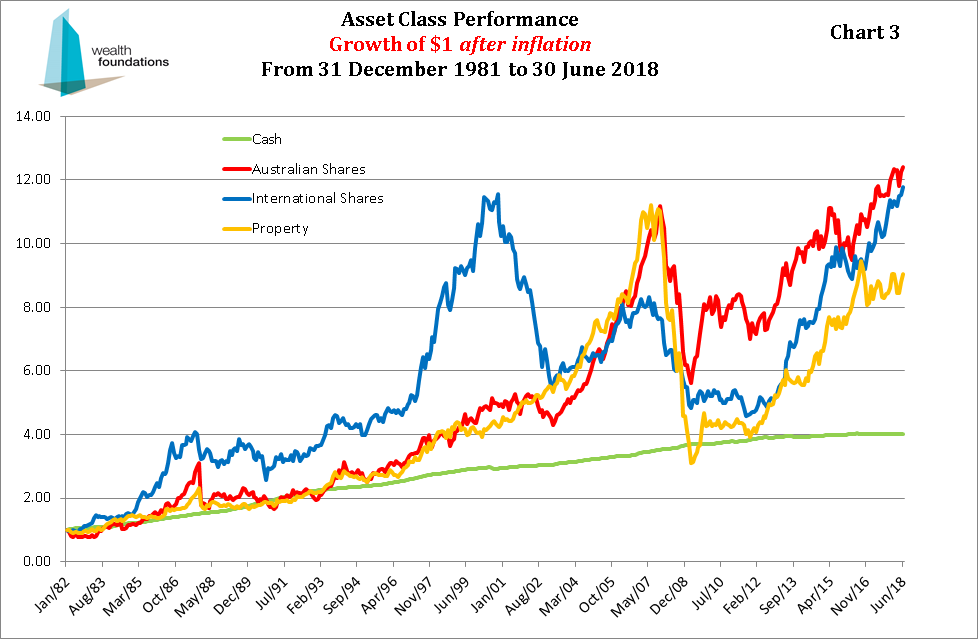
Table 1
Asset Class Returns (after inflation) to 30 June 2018
| 3 Months | 1 Year | 5 Years | 10 Years | 20 Years | Since 31 Dec 1981 | |
| Cash | 0.2% | -0.2% | 0.4% | 1.25% | 3.9% | 3.7% |
| Australian Shares | 5.4% | 12.5% | 7.2% | 4.8% | 7.3% | 7.0% |
| International Shares | 4.9% | 18.0% | 11.8% | 7.6% | 7.0% | 6.6% |
| Property | 6.0% | 12.2% | 10.5% | 4.5% | 6.3% | 6.3% |
The five years to June 2018 have been very kind to growth asset investors, compared with investing in cash. But that followed a period of five years when the riskier asset classes performed poorly – this can be seen by the sharp drop in the premium over cash for investing in the riskier growth asset classes for the 10 years to June 2018 compared with the 5 years to June 2018.
The message: Growth assets are expected to outperform defensive assets over the long term. But don’t delude yourself. These expected (but not guaranteed) higher returns always come at the cost of increased risk. Have you “the stomach” and the patience to give yourself the chance of earning those potentially higher returns?
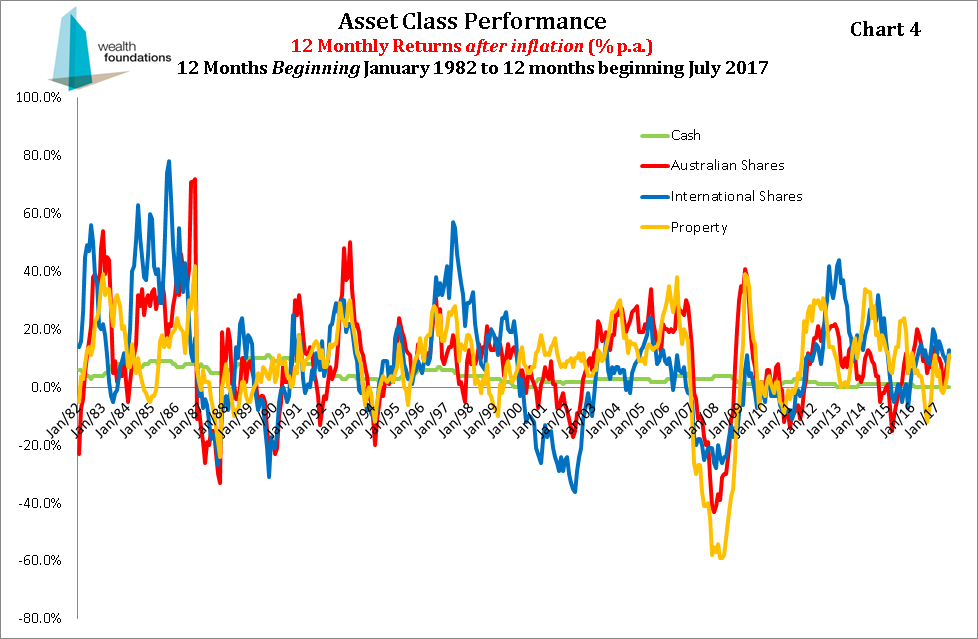
Have you the "stomach" and the "patience"?
First, the “stomach” part. The chart opposite (Chart 4) shows rolling 12 months returns for the identified asset classes.
It goes without saying that over 12 month periods the returns of the growth asset classes were extremely volatile. While we believe it is impossible to reliably predict what future asset class returns will be, we are confident that growth asset class volatility will persist.
If you cannot emotionally handle the (hopefully) occasional negative 40% annual returns, you are unlikely to have the patience to experience the potential higher returns that a longer term approach to investment offers.
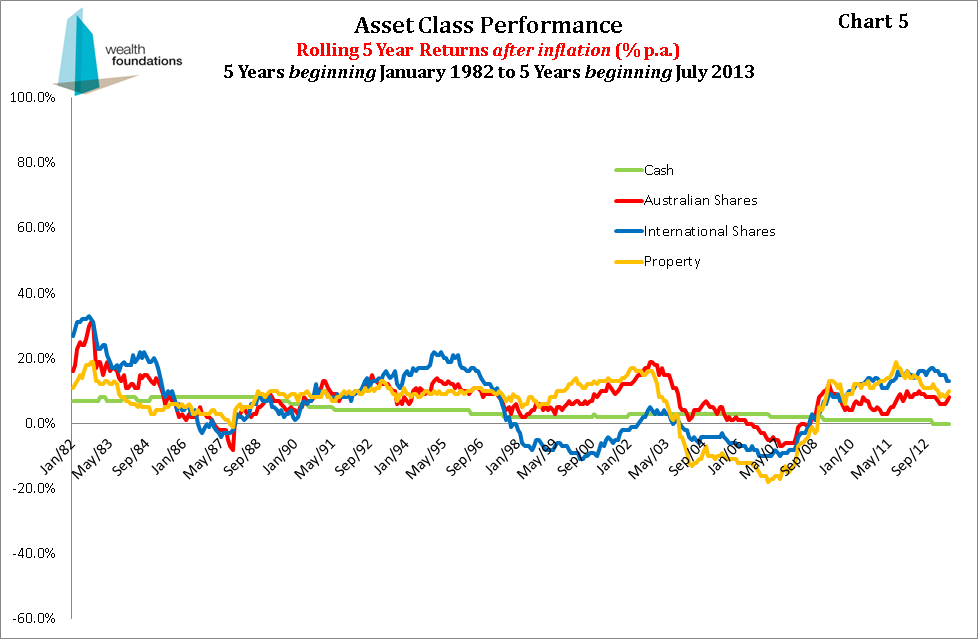
The adjacent chart (Chart 5) shows that on a five year rolling basis there were considerably less negative return experiences with growth assets than on a 12 month rolling basis.
With the investment experience extended to ten years (Chart 6), there were few negative growth asset outcomes and, mostly, growth asset classes outperformed cash.
The message: When it comes to investment returns there are no certainties, but if you want to give yourself the best chance of earning returns in excess of that from “money in the bank” you must be able to withstand considerable short term volatility and have at least a 10 year investment horizon.

But what if I could buy low and sell high?
It is tempting to believe that risk could be avoided and returns enhanced by exiting growth asset classes before they fall and entering them before they rise.
Such reliably successful market timing is both inconsistent with our view that short term asset class returns are essentially random (see “Markets work” ) and the robust research.
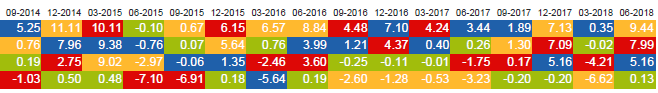
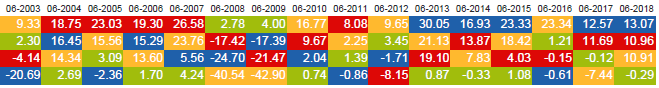
But to test your prediction skills, we invite you to examine the asset class return information for the past sixteen:
to 30 June 2018, shown opposite.
There may be a pattern in the data that can be used to forecast the next period’s returns, but we can’t see it! It appears to us that knowing what asset class returns did last period, or the past several periods, has little or no bearing on what they will do next period.
The Message: Market timing is fraught with difficulties and offers no expected return. However, it does come with certain research and transaction costs and, potentially, early crystallisation of taxable gains.
Legend for reading the charts below:
16 months to June 2018 (asset class ranked highest to lowest return for each month):

16 quarters to June 2018 (asset class ranked highest to lowest return for each quarter):
16 years to June 2018 (asset class ranked highest to lowest return for each year):
Is there an antidote?
We do not know a reliable way to give you a chance to obtain increased investment returns without taking increased risk. But, as explained in “Foundations of Financial Economics” there are ways of taking risk that are smarter than others. A key principle is to diversify as widely as cost effectively possible.
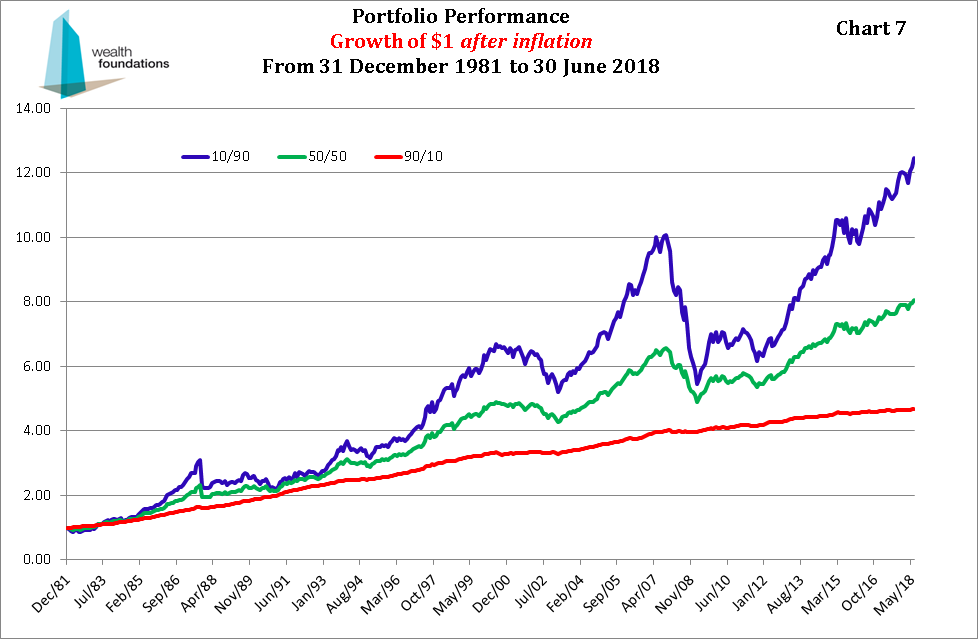
In “Structure explains performance” , we introduced five increasingly risky, well diversified portfolios. These varied from the “90/10” portfolio made up of 90% defensive assets (i.e. cash) and 10% growth assets (i.e. Australian shares, international shares and listed property) to the “10/90” portfolio comprising 10% defensive assets and 90% growth assets. Chart 7 above shows the growth of a $1 (after inflation) invested in three of the portfolios from 31 December 1981 to 30 June 2018. Over the period, the high growth “10/90” portfolio was rewarded for the additional risk compared with the “90/10” portfolio, but at the cost of considerable volatility.
The table below shows the after-inflation returns of the charted portfolios over various periods to 30 June 2018:
Table 2
Portfolio Returns (after inflation) to 30 June 2018:
3 Months | 1 Year | 5 Years | 10 Years | 20 Years | Since 31 Dec 1981 | |
90/10 | 0.8% | 0.9% | 1.3% | 1.7% | 4.3% | 4.3% |
50/50 | 3.6% | 5.6% | 5.2% | 3.4% | 5.9% | 5.9% |
10/90 | 6.6% | 10.5% | 9.1% | 4.9% | 7.2% | 7.2% |
There was a meaningful premium for additional risk for all periods examined. Also, the returns of the “10/90” portfolio compared favourably with all individual growth asset classes for investment periods beyond 10 years (compare with Table 1).
The message: A well diversified growth oriented portfolio containing allocations to each of the growth asset classes is expected to have returns roughly equivalent to the weighted average returns of the underlying growth asset classes, over extended investment periods.
Diversification reduces volatility
But the real benefit of diversification is reduced volatility, not increased return.
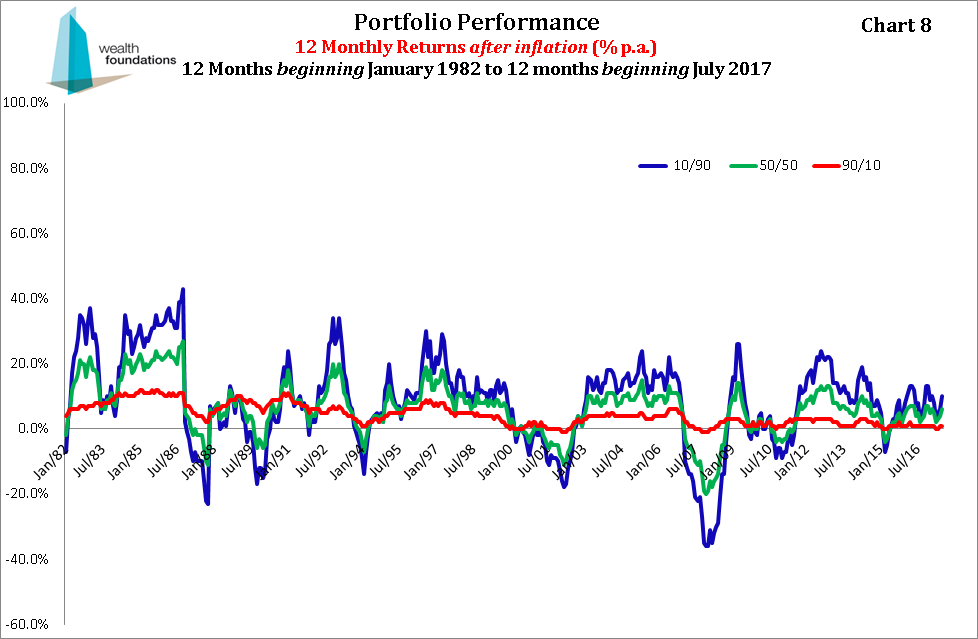
Chart 8, opposite, shows rolling 12 months returns for the identified portfolios. There were a number of significant negative returns for “10/90” portfolio.
However, this chart should be compared with Chart 4 to appreciate the reduction in volatility achieved by a diversified high growth portfolio compared with investing in individual growth asset classes.
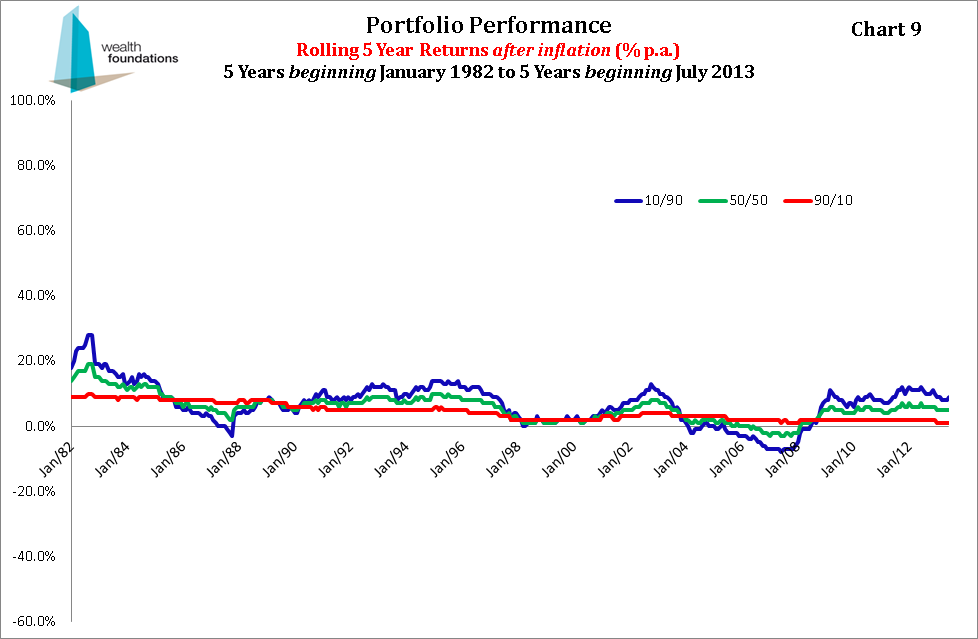
Chart 9 shows that as the investment horizon extends to 5 years, the high growth portfolio experienced considerably less negative periods.
The comparison with Chart 5 starkly reveals how overall volatility is reduced by investing in a diversified high growth portfolio rather than individual growth asset classes. The risk of unsuccessfully concentrating in one asset class (e.g. international shares from about December 1997 to about December 2011) is also ameliorated.
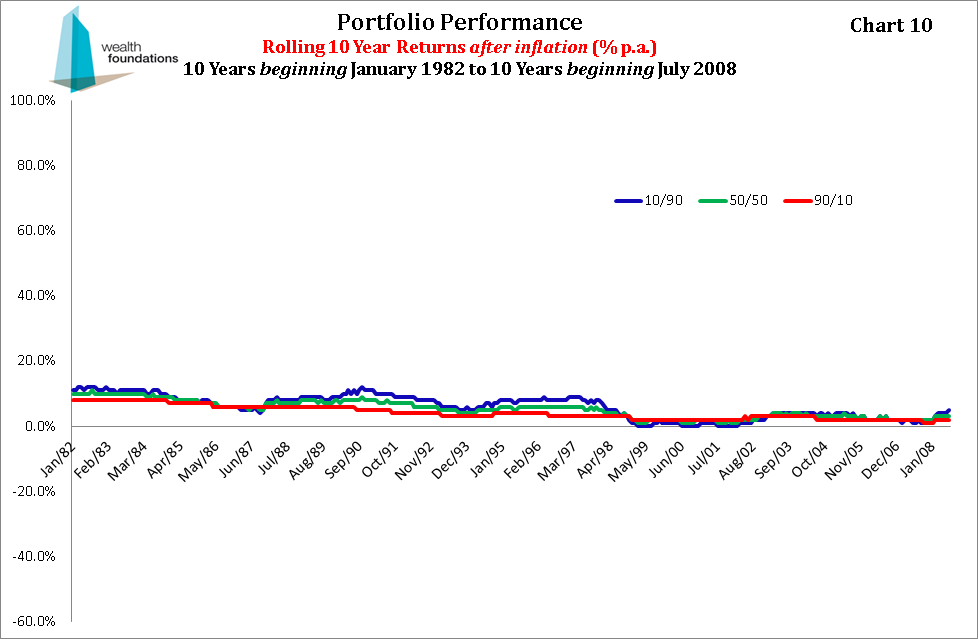
Finally, a ten year investment experience (Chart 10), saw almost all positive returns for the high growth portfolio, mostly in excess of the “90/10” portfolio and with much less volatility than for the individual growth asset classes – compare with Chart 6.
The message: To give yourself the best chance of increased investment returns and a satisfying investment experience, diversify broadly across the growth asset classes and take a long term view. Serious investment is a disciplined process, not a spectator sport.