The most important investment decision...
“Structure explains performance” is our most conceptually simple philosophy, but almost certainly the most important. Structure refers to asset allocation – how you apportion your investments between:
The share asset classes can then be further broken down into the sub asset classes of small and value.
The “structure” or asset allocation choice is a decision about how much risk you feel comfortable with or need to take to achieve your objectives. The decision is so important because it is your asset allocation or risk decision that will drive your investment portfolio’s performance i.e. its long term expected return.
Asset allocation drives return...
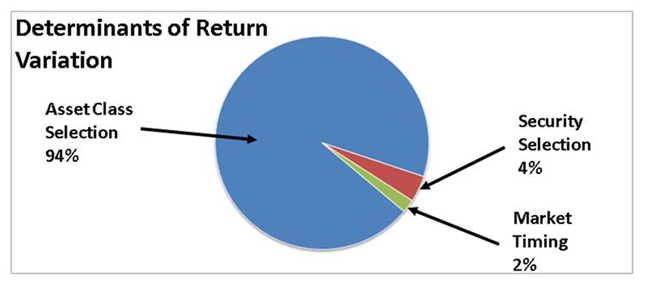
The first major study highlighting the importance of asset allocation for portfolio performance was completed by Brinson, Hood and Beebower in 1986. They compared the returns of 91 large US pension plans over a 10 year period and their findings are displayed on the right.
They found that asset class selection explained 94% of the variation in the returns of the plans. Stock selection and market timing contributed very little to the explanation. Initially, the results were incorrectly interpreted to provide evidence for the statement that long run portfolio performance is driven by asset allocation. However, a subsequent paper by Ibbotson and Kaplan in 2000 directly examined this matter and concluded that asset allocation explains 100% of portfolio performance, before fees and taxes.

Asset Allocation and risk...
To examine the relationship between asset allocation (risk) and return, we consider the following progressively more growth oriented investment portfolios:
Asset Class / Portfolios | “90/10” | “70/30” | “50/50” | “30/70” | “10/90” |
| Cash and fixed Interest* | 90 | 70 | 50 | 30 | 10 |
| Australian Shares** | 6 | 18 | 27.5 | 35 | 45 |
| International Shares*** | 4 | 12 | 17.5 | 25 | 30 |
| Property**** | 0 | 0 | 5 | 10 | 15 |
100 | 100 | 100 | 100 | 100 |
*As measured by UBS Warburg 90 Day Bank Bill Index
**As measured by S&P / ASX300 Accumulation Index
***As measured by MSCI World ex Australia (net dividends)
****As measured by S%P / ASX300 Property Trust Accumulation Index
The “90/10”portfolio is low risk, as 90% of the total is held in cash and fixed interest investments. As you move across the table to the right, risk increases as the amount allocated to cash and fixed interest progressively decreases, while the amount allocated to growth assets (i.e. shares and property) progressively increases.
The table below shows that over the period December 1981-June 2008, return did in fact increase as risk increased. The total reward for taking this risk is represented by the “Growth of $1” column that shows the growth of $1 over the period, assuming it was invested in each portfolio on 31 December 1981.
Volatility or standard deviation is the measure of risk shown in the table – it is a calculation of how much the monthly portfolio returns vary about the average return of the portfolio. High volatility can be very unsettling for investors. For many, so unsettling that they are unwilling to expose themselves to it, despite being confident that higher volatility offers the likelihood of higher returns.
Portfolio Performance
December 1981 – June 2008
Portfolio | Annualised Return (%) | Growth of $1 | Annualised Volatility (%) |
| “90/10” | 9.81 | $11.95 | 2.70 |
| “70/30” | 10.67 | $14.67 | 4.98 |
| “50/50” | 11.39 | $17.45 | 7.43 |
| “30/70” | 12.01 | $20.20 | 9.96 |
| “10/90” | 12.57 | $23.08 | 12.60 |
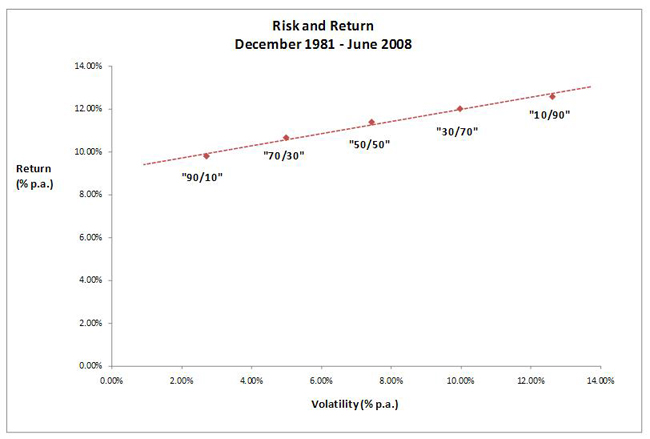
The chart below shows the risk (as volatility) and return relationships between the portfolios graphically. It starkly reveals the risk-return tradeoff. However, while the conclusion may be drawn that for the period shown large increases in volatility were required to obtain only small increases in return, it does not capture the fact that small increases in return compounded over long periods of time can result in significant differences in end wealth – this is highlighted by the “Growth of $1” column in the table above.
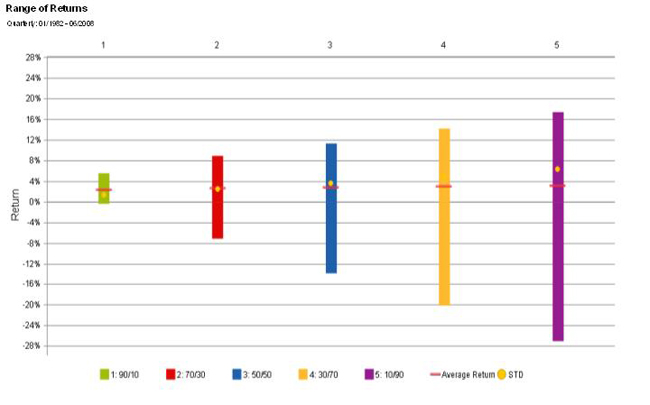
Another thing this neat graphic of risk and return does not capture is the sometimes “gut wrenching” nature of volatility. The chart below shows the range of quarterly returns for each of the portfolios from December 1981 – June 2008, as well as the average quarterly return and quarterly standard deviation or volatility. For example, the “10/90”portfolio had a quarterly range of returns from a lowest of -27.00% and a highest of 17.49%, compared with the “90/10”portfolio with a lowest quarter of -0.31% and a highest of 5.49%.

It is easy to be cavalier about risk when markets are trending upwards. However, an investor will not be capable of achieving the long term rewards of greater risk unless they can cope with sometimes significant and almost always unexpected downturns.

Asset allocation fundamentals
Your asset allocation, whether determined as a result of a conscious decision or by default, defines the investment risk you are exposed to and will drive your returns. Of course, as discussed under the principles of “Risk and return are related” and “Diversification is key”, unless you have structured your investment portfolio appropriately, you may be taking a lot of risk that has no expected return.
The key lessons to be taken from our view that “Structure explains performance” include:
