
 Perceived low interest rates are driving investor and borrower behaviour
Both bank term deposit and lending rates are at or close to generational lows. In response, term deposit investors are searching for higher yielding opportunities, having seen rates approximately halve since March 2008. Often, they are purchasing products specifically designed to provide higher income but with a bundle of unappreciated risks attached. Or, they are venturing into “nice, safe” high dividend paying shares!
On the other hand, housing borrowers, are in seventh heaven. More people now qualify to borrow more money to pay even higher house prices. The banks, eager to maintain and increase profits, are only too happy to oblige.
But we think many investors and borrowers suffer from what economists call “money illusion” when it comes to interest rates. They make decisions based on nominal or actual rates, failing to take account of actual and expected inflation. Our previous articles, “Are home loan interest rates really low?” and “Baby boomers’ housing experience may not repeat” examined this issue primarily from a borrowing perspective.
In this article, we examine money and, perhaps, tax illusion from an investor viewpoint. Just as borrowers are potentially over committing themselves because they consider that interest rates are low, the same consideration is driving investors to take risks they don’t understand and may not need to take. If things go wrong, the consequences could be severe.
What are interest rates doing, after-inflation and after-tax?
There is no doubt that in nominal terms, term deposits rates are at or near historical lows, as revealed in the chart below:

Rates of about 3.2% p.a. as at 30 June 2013 are well below the average 7.1% p.a. recorded since March 1982 and significantly less than the double digit returns on offer through most of the 1980’s. Many current retirees, looking for a safe and steady income on their investments, may think they are hard done by compared with their counterparts of the 1980’s.
But a key determinant of interest rate levels is the inflation rate. The significant drop in interest rates experienced since the early 1990’s largely mirrors the reduction in inflation, as revealed in the following chart:
It’s the real, or after-inflation, return rather than the nominal return on your investments that should be your primary concern. It determines the amount of goods and services your investment income can buy.
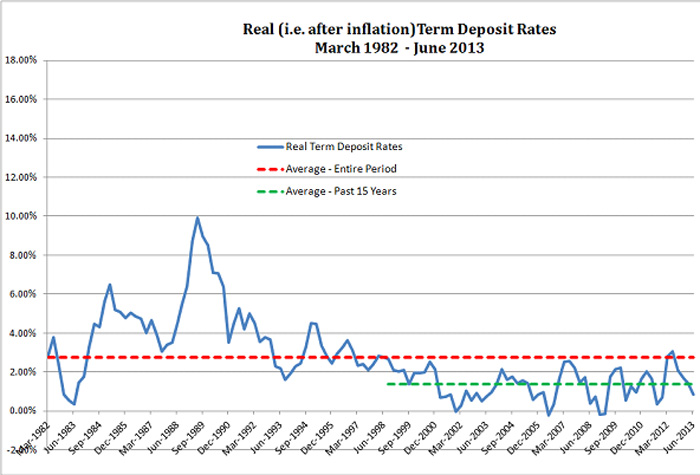
The following chart shows the real term deposit return (actual return less inflation) for the period under consideration:
After-inflation, term deposit rates were well above average through the 1980’s but have provided a significantly lower return of between 0-3% p.a. above inflation for the past 15 or so years. To expect anything more than this on a long term basis from what is regarded as a very low risk investment is, in our view, unrealistic. In particular, there is nothing to suggest that current term deposit rates are sufficiently low, in real terms, to prompt significant changes in investor risk taking behaviour.
The obvious question then is why were real rates so much higher in the 1980’s and why shouldn’t that experience be perceived as the normal. At least a partial explanation rests on the interaction of the tax system and inflation. Investment income is taxed before inflation, so the same real interest rate provides a lower after-tax real return at high inflation rates than at low inflation rates.
The table below illustrates this. It shows that the after-tax return for a 3% p.a. real rate is higher when inflation is a “Low” 2.5% p.a. than when it is a “High” 8% p.a.:
| “Low” Inflation (% p.a.) | “High” Inflation (% p.a.) |
| (1) Inflation | 2.50 | 8.00 |
| (2) Real interest rate | 3.00 | 3.00 |
| (3) Actual interest rate*(=(1)*(2)) | 5.50 | 11.00 |
| (4) Tax (at 30%) | -1.65 | -3.30 |
| (5) After-tax actual interest rate (=(3)-(4)) | 3.85 | 7.70 |
| (6) After-tax real interest rate* (=(5)-(1)) | 1.35 | -0.30 |
* Compounding effect ignored
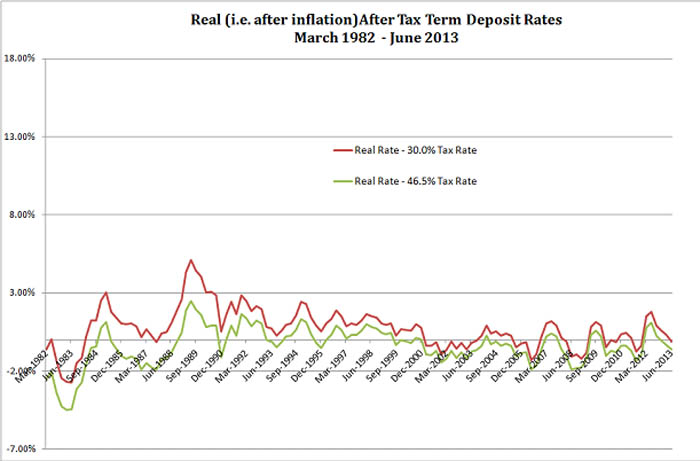
The chart below provides historical after-tax and after-inflation term deposit rates for two tax rates, the current top marginal tax rate (46.5%) and the company tax rate (30%):

Despite high actual and real term deposit rates during the 1980’s, the high inflation over that period resulted in real, after-tax rates that were not that much higher, on average, than those experienced in the past 15 years. The frequent negative real, after-tax rates experienced by investors in the 1980’s were mirrored by low and, sometimes, negative, real after-tax costs for borrowers, even though actual borrowing rates were high.
So, tax paying borrowers could afford to pay high real interest rates, enabling banks to offer high real rates to attract deposits. At low rates of inflation, this non-neutral tax effect becomes less distorting. It’s hard to see how the high real rates of the 1980’s could return without inflation again rising to levels experienced at that time.
Interest rates aren’t as low as they seem
In terms of what really matters (i.e. after-tax and after-inflation), interest rates are not at levels that would appear to justify some of the significant changes in both investor and borrower behaviour that we are currently seeing. Real interest rates would need to fall further (possibly to or below zero) and/or inflation rise dramatically.
Perhaps, that is the expectation, and both investors and borrowers are moving in anticipation. But we think it has more to do with them suffering a dose of money illusion. As a result, they are exposing themselves to risks they don’t fully appreciate.


