

Share and cash investment returns are unexciting
It feels like the Australian share market has been going up and down in about the same spot for the past six or seven years. Many are becoming disillusioned with shares as an investment class and are looking to “juice returns” with the various hybrid structures and private equity “opportunities” on offer to take advantage of the discontent.
Cash, in the form of term deposits, has also lost its lustre, with yields at record lows. It’s not surprising that in this environment the perennial favourite, direct investment into residential property, has become even more popular. The house price rises experienced over the past three or four years, particularly in Sydney and Melbourne, make the share market appear a pretty dull alternative.
This article examines some of the historical facts that underpin current feelings. While we don’t know what will happen in the future, the past suggests that current investment returns are not inconsistent with what investment theory would expect and may not be a good guide to future investment returns.
Investment history doesn’t suggest anything unusual
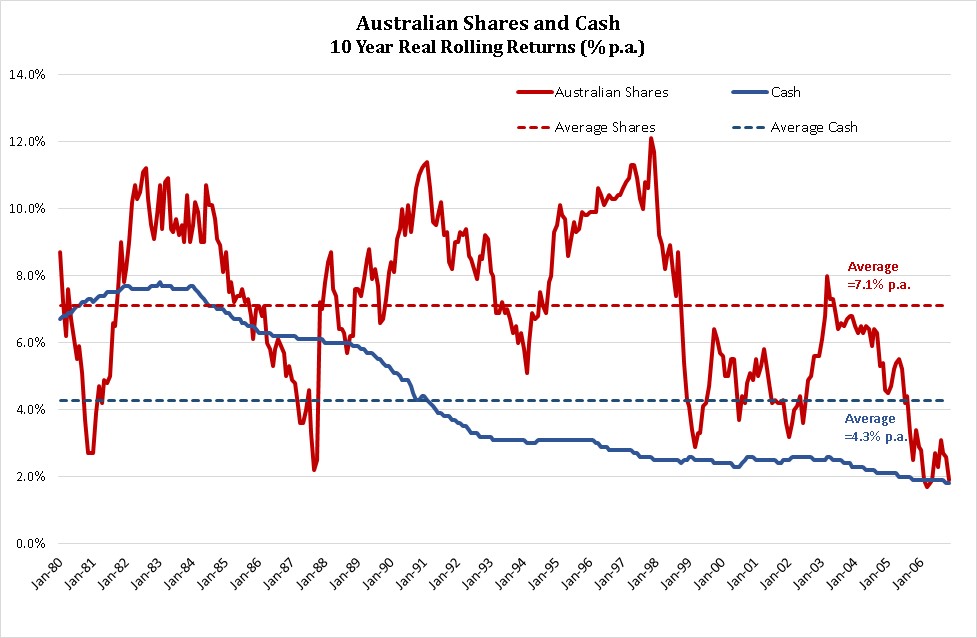
To provide an historical perspective to our discussion, the chart below shows rolling 10 year, annualised, after-inflation, returns for both the Australian share market (i.e. ASX300 Total Return) and cash (i.e. the bank bill index) since December 1979.

The most recent data point for Australian shares, the rolling, real, 10 year period from 1 November 2006 to 31 October 2016, at 1.9% p.a., confirms the disappointment with shares that investors are currently feeling. There was virtually no premium earned for the significant risk taken compared with investing in cash, that earned 1.8% p.a. for the ten years. The long term decline in the return for cash is also evident, although the rate of decline has slowed considerably since about 1996.
The Global Financial Crisis, of course, is primarily responsible for pulling down the rolling ten year share returns for all periods commencing from about December 1998 to November 2006. It explains why for most of this period annualised ten year rolling returns were well below the long term average of 7.1% p.a.
But the 36 year plus history since December 1979 suggests, but does not guarantee, that prolonged subdued periods of sharemarket returns are followed by prolonged periods of returns that are significantly in excess of the returns from investing in cash. And, if it’s any consolation, the more recent share market 10 year returns, relative to cash, are significantly better than many of the 10 year experiences that commenced in the 1980’s.
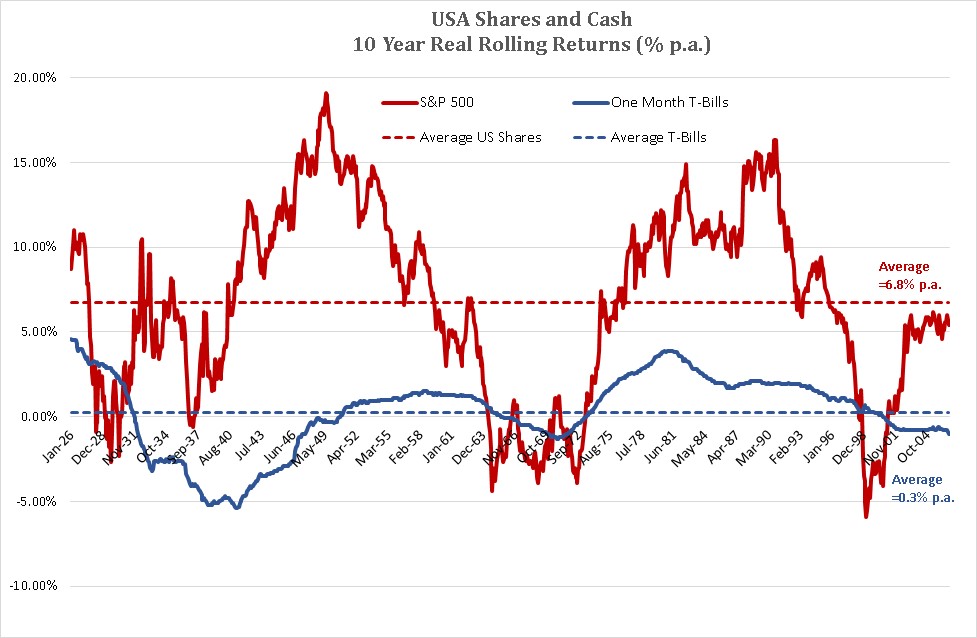
However, to gain a longer term perspective on the behaviour of share markets, it’s salutary to examine a more extended history of the US sharemarket. The following chart shows rolling ten year real returns for US shares (represented by the S&P500 index experience) and cash (the one month Treasury Bill rate) commencing December 1925 to October 2006:

It reveals a number of considerably bleaker share market experiences than are captured in the more recent Australian data, with many 10 year periods commencing in the mid-late 1920’s, the 1960’s and the late 1990’s recording negative real returns. The -5.90% p.a. return for the period commencing March 1999 (encompassing both the tech stock crash and the Global Financial Crisis) tested the patience of the most disciplined share investor.
But, at least for the approximately 90 year period examined, share markets always recovered from the deepest gloom. And for about 84% of the time, the returns from shares exceeded the returns from cash – on average, for rolling ten years, this premium was a massive 6.5% p.a.
Also, the chart suggests that the high real cash rates experienced both in the US and Australia for 10 year periods commencing in the 1980’s should probably be seen more as the exception rather than the norm. The average 4.3% p.a. experienced in Australia since the early 1980’s appears to be an anomaly, when viewed against the long term US experience i.e. an average of 0.3% p.a. for T-Bills.
The longer term US chart also shows that negative real cash rates, that many Australians consider as almost inconceivable, are much less rare than the more recent Australian data would suggest. Expecting to earn high real returns on a very low risk investment never makes financial sense. But it’s difficult to wean people off this expectation when that has been their recent experience. Unfortunately, it often leads to poor decisions when trying to recreate this “nirvana” with other investment alternatives (e.g. high dividend yielding shares, hybrid structures, residential housing (?)).
There is no reason to abandon investment fundamentals
Investing in shares (and growth assets, more generally) isn’t for the faint hearted. There’s nothing to say that when markets have performed poorly, they won’t continue to perform poorly. But history suggests that they do eventually bounce back.
And both finance theory and history suggest that, over extended periods, the returns from the share market should exceed the return from cash like investments, as a reward for the significantly greater risk.
But this premium can’t exist all the time. It is, in fact, the poor performing periods that set up the opportunity for the high performing periods with the expected long term premium only reliably available to the patient investor.
Both history and finance theory also suggest you should not expect high real returns from cash-like, low risk defensive investments. Their primary purpose is to reduce the volatility of a well-structured investment portfolio, rather than to significantly enhance returns.
In summary, there is nothing in recent history to suggest that we are seeing a change in the fundamental underpinnings of sound investment practice. But, unfortunately, low share market and cash returns create the pre-conditions for the almost inevitable future tales of woe from those who lose discipline and are seduced by alternative, apparent low risk, high return paths to investment wealth.
