

Spending on housing has risen almost unabated since 1960 …
We have written previously about current housing affordability for young adult Australians (see “Are Australian house prices too high?” and “Housing and home loan affordability … again”). Our focus was the perceived inconsistency for those in their mid twenties to mid thirties of meeting both the current cost of housing (for purchase or rent) and accumulating sufficient investment wealth for financial independence by their mid-sixties.
It is sometimes suggested that a potential resolution to this “inconsistency” is a reduction in spending on other goods and services. The chart below shows how Australian households have allocated their disposable income over the period from June 1960 to June 2015:
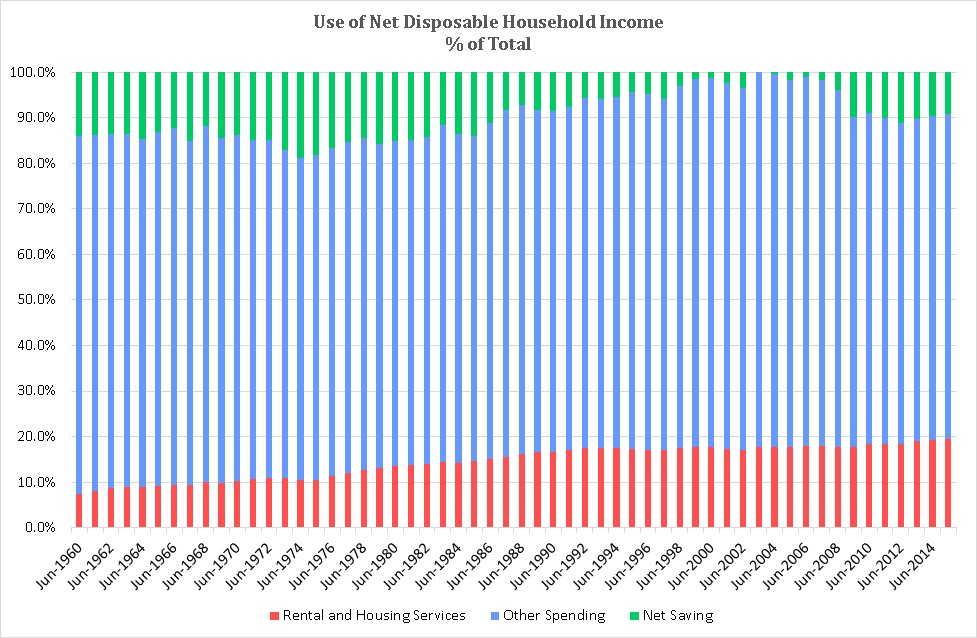
It shows that they increased their spending on housing from 7.4% of net disposable household income as at June 1960 to 19.5% as at June 2015. But from about 1975 through to 2004, the relentless increased spending on housing services was largely met by reduced saving rather than reduced “Other spending”.
It was not until the Global Financial Crisis in 2009 that Australians collectively “woke up” to the reality that if they wanted to both increase spending on housing services and accumulate wealth, and not rely totally on capital gains, “Other spending” had to give.
The chart below shows that very low net savings rates over the 10 year period from 1998-2008 translated into the household sector becoming a net borrower:
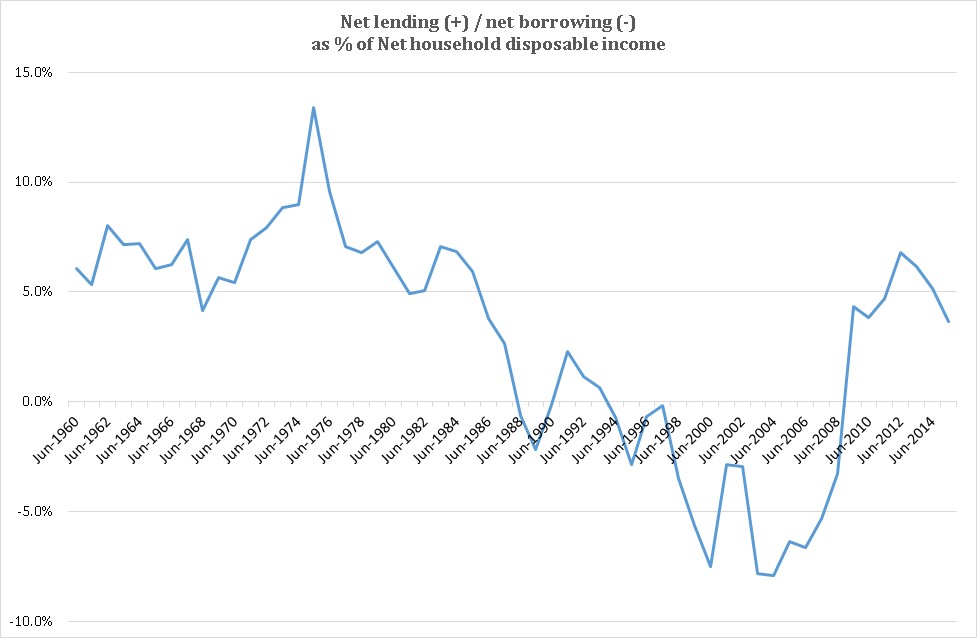
For households to increase their net holdings of financial wealth over this period, capital gains needed to exceed net borrowing. The GFC exposed the risks associated with this strategy.
But housing has become relatively very expensive
But the behavioural changes in response to the GFC appear to have been short lived. Spending on housing continues to increase while net saving and net lending by households are again falling.
How realistic is it to expect spending on housing to continue to rise both as a share of household disposable income and total consumption spending, given it is already at record levels? And is it likely that households can again defer reducing “Other spending” to accommodate a further increase in housing spending by saving less and going even deeper into debt?
We would be concerned if these hypotheticals were realised, but it sometimes seems that Australians penchant for housing knows no bounds. The chart below shows a percentage breakdown of actual spending by category of total consumption expenditure from June 1986 to June 2015. The “red shaded” bars show categories that have risen while the “blue shaded” bars reveal those that have declined.
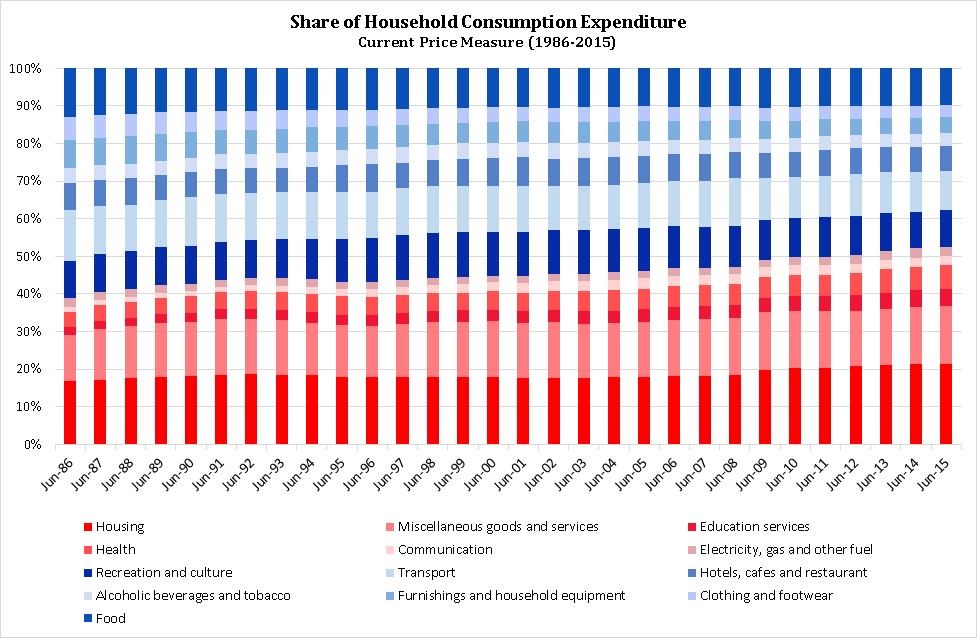
Clearly, housing isn’t the only spending area to have increased, with pressure for further rises, particularly in the areas of health and education, showing no signs of easing. But it’s pure speculation to suggest which category/ies would contract in future to accommodate any further increases in housing.
However, it’s also interesting to note that the increased allocation of income and spending to housing has not translated into an increase in the quantity of housing (relative to other consumption categories). The chart below adjusts the previous chart for changes in prices, so that a measure of relative changes in volumes by category is obtained.
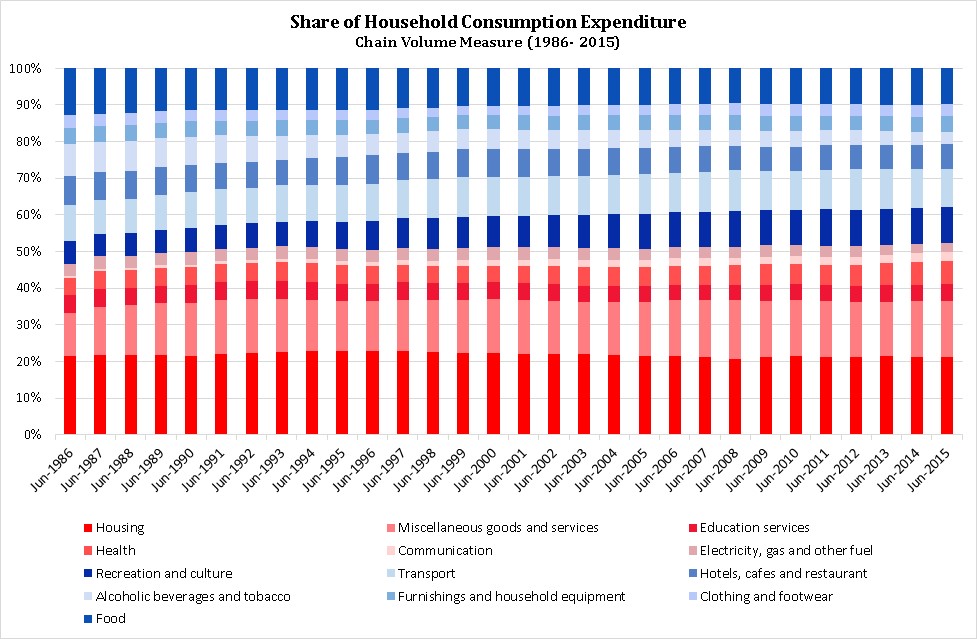
It reveals that the relative amount of real consumption directed to housing actually fell from 22.3% to 21.3% (a fall of 4.5%) from June 1986 to June 2015, compared with a rise in actual spending from 16.9% to 21.5% (a rise of 27.2%) over the same period. Implied is a massive relative price increase for housing of 33.2%! No wonder young adults feel they need to pay so much more to buy not very much in terms of housing, when their hard earned dollars appear to go so much further in other areas of consumption spending (i.e. the blue shaded categories).
With regard to whether Australians can continue to increase their spending on housing without reducing other spending, by borrowing more (as for the period 1998-2008), I can only say I hope not. The chart below reveals the massive rise in the ratio of household debt to household income that has occurred over the period since June 1988.
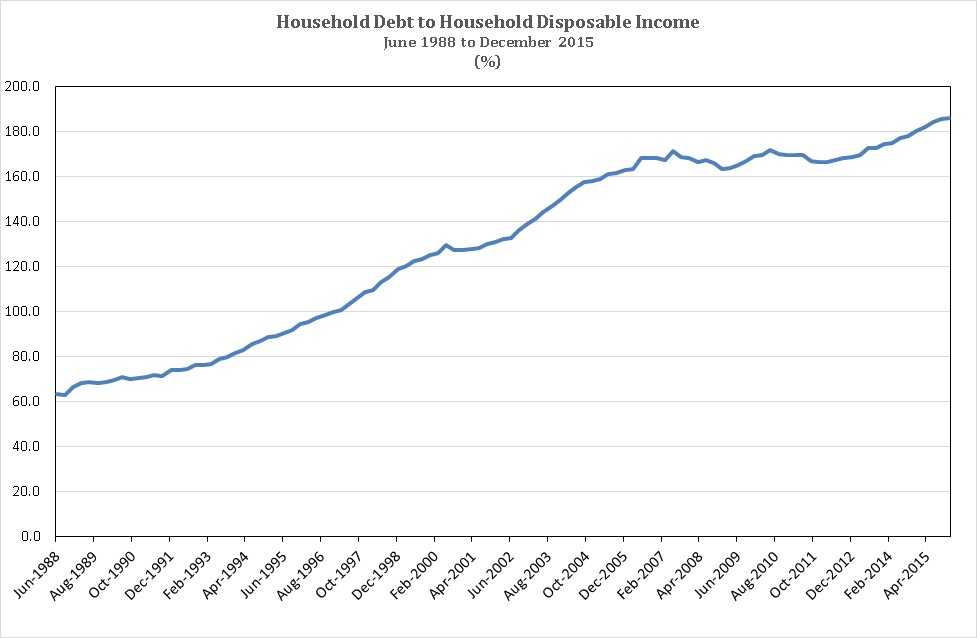
With household debt currently in excess of 180% of income, Australian households in total are among the most indebted in the developed world. We are already particularly vulnerable to a negative economic shock and any further increase in the debt ratio would only exacerbate an already uncomfortably high level of risk.
Young adults are responding to the high cost of housing
Given the housing spending trends discussed above, it’s little wonder that home ownership for young adults, in particular, continues to fall, as revealed in the chart below.
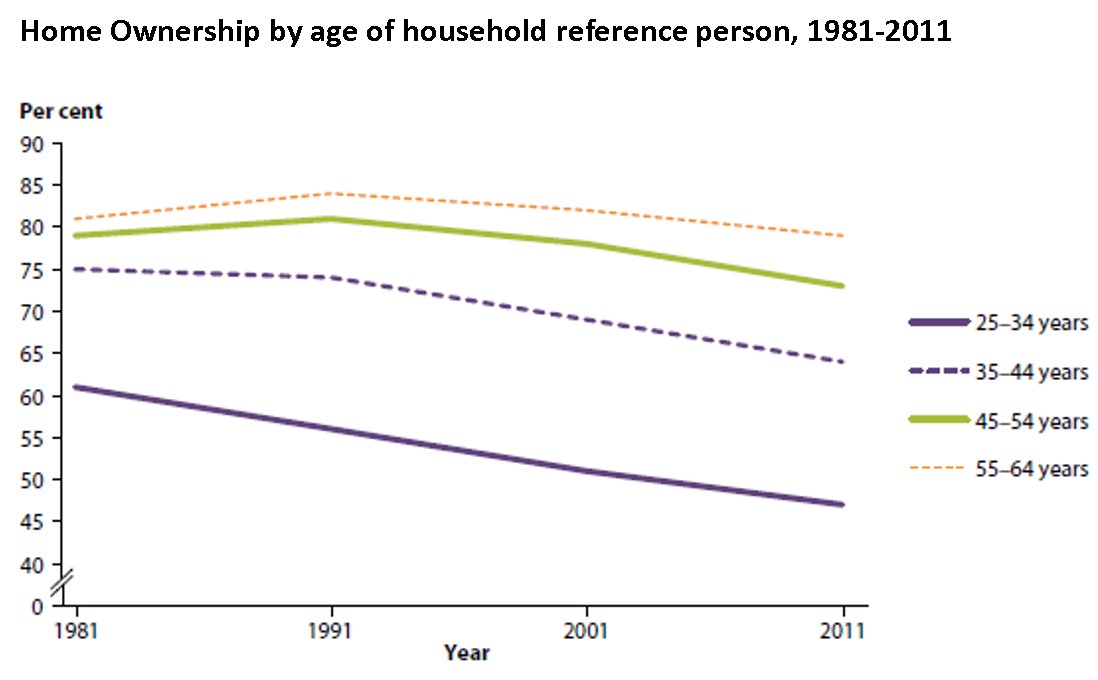
Not only has home ownership become increasingly unaffordable (as discussed in previous articles), the cost of housing (for both ownership and rent) has become relatively so much more expensive than many other spending alternatives. It’s therefore entirely rational that many young adults, often despite the protestations of their parents, are choosing to spend less on expensive housing and more on other goods and services (e.g. holidays, eating out, entertainment, clothes) that offer better relative value.
This substitution is not unreasonable. However, young adults need to understand that while it may be “rational” to forego the quantity/quality of housing their parents took for granted in response to the huge relative price increase, they should not lose sight of the need to accumulate sufficient investment wealth to finance their desired financial futures.
