


A summary of household wealth and income
Every two years, the Australian Bureau of Statistics (“ABS”) releases its survey of Australian household income and wealth. The latest release[1] relates to the 2015-16 year. It provides the opportunity to update our “Household Income, Wealth and Debt in Australia” article of September 2015, that examined various findings from the 2013-14 survey, and to drill down a little to further into the growing level of debt held by Australian households.
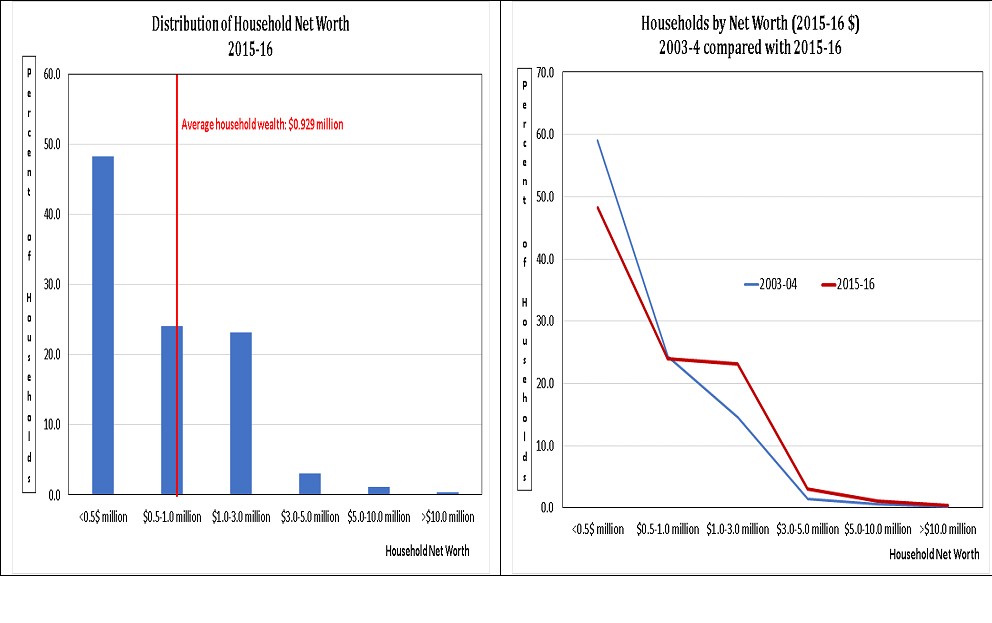
The left hand side of the chart below shows how household wealth or net worth was distributed in 2015-16, while the chart on the right hand side shows how that distribution has changed (in 2015-16 dollars) over the 12 years since 2003-04. Some takeaways from the charts include:
- Only 4.6% of households (or about 250,000 households) have net worth in excess of $3 million;
- The percentage of households with net worth in excess of $5 million has not changed significantly since 2003-04; and
- Those with net worth less than $0.5 million fell from 59.1% of households in 2003-04 to 48.2% in 2015-16 while those with net worth between $1.0 to $3.0 million rose from 14.5% to 23.2% over the same period. Presumably, much of the increase was explained by the increase in the real (after-inflation) value of residential dwellings.
The following charts examine the distribution of household income for 2015-16 and the change in that distribution over the past 12 years (in 2015-16 dollars).
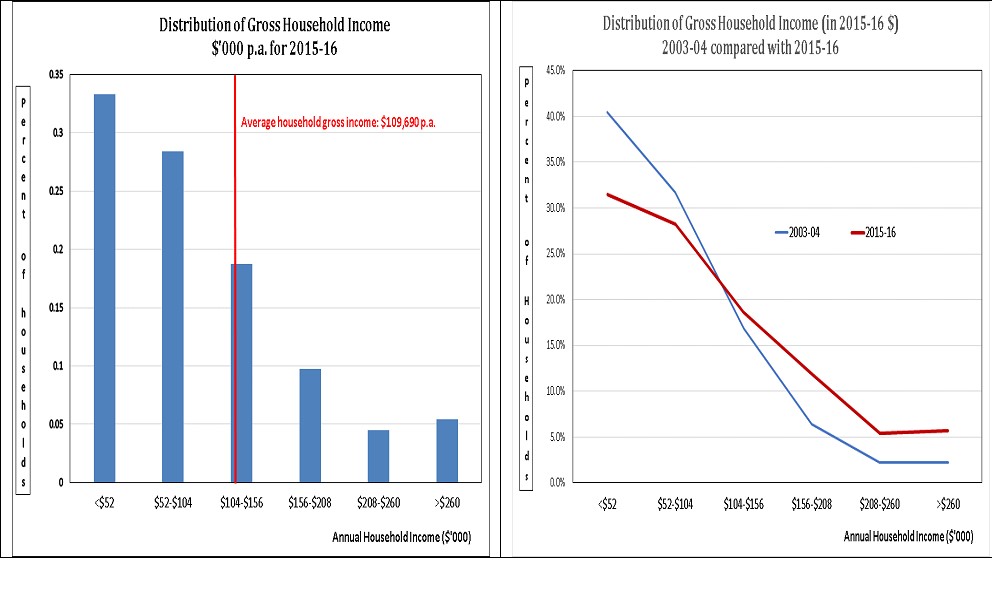
They reveal that in 2015-16 about 11.1% of households (or about 998,000 households) had gross income in excess of $208,000 p.a. (i.e. $4,000 a week), compared with only 4.4% in 2003-04. It is important to understand that gross income includes an estimate of imputed rent for those that own their home suggesting that at least part of the growth in household incomes apparent since 2003-04 reflects increases in the real cost of housing accommodation.
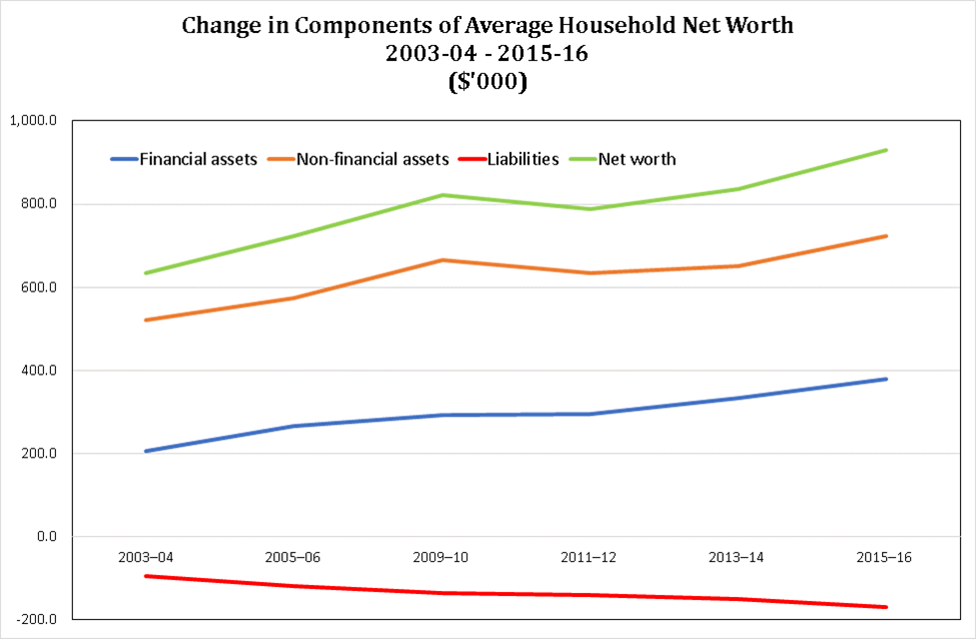
The chart below shows changes in average real household net worth, and its major components, from 2003-04 to 2015-16. The latest survey revealed a strong increase in net worth (11.3%) on the 2013-14 survey, driven by large gains in financial assets of 13.3% and non-financial (primarily property) assets of 11.0%, offset by a rise in liabilities (primarily property related debt) of 12.8%.
A closer examination of household debt
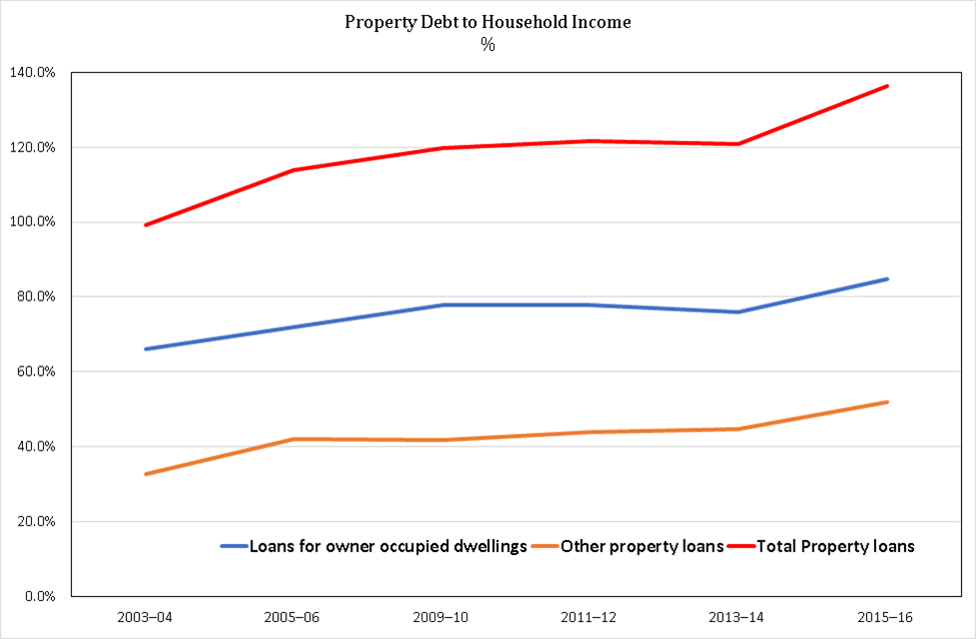
Our 2015 article focused on Australian households’ willingness to take on increasing amounts of debt, particularly property related debt. Despite being at what we regarded as worryingly high levels in 2013-14, the level of property related debt, relative to household income, has risen significantly in the two years since the last survey, as revealed in the chart below.
What are some of the characteristics of the households who are borrowing all this debt? The left hand chart below looks at how the proportion of “households with debt” has changed for each net worth quintile for the six surveys conducted since 2003-04 (survey not completed in 2007-08). There is no apparent trend in the percentage of households holding debt by net worth quintile.
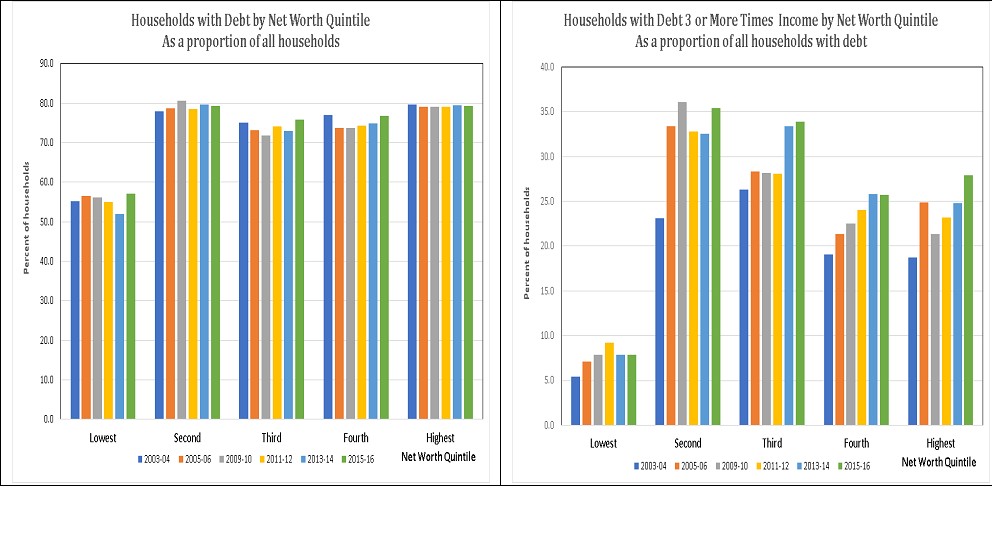
However, when the criteria is “Debt 3 or more times income”, the right hand chart reveals that across the three highest net worth quintiles the relevant proportion of households has risen dramatically, particularly since 2011-12. The ABS categorises such households as “over-indebted”. It is our view that once debt to income ratios rise too much beyond three, it becomes increasingly hard to both repay the debt and accumulate sufficient wealth for financial independence.
Some commentators have suggested that rising household debt levels aren’t a financial stability concern because much of the increased debt is held by households with higher net worth. But the fact that wealthier households are increasingly stretching themselves in terms of cash flow indicates that such complacency may be misguided.
This cash flow concern increases when the debt data is examined based on the age of the reference person that responded to the surveys. The left hand chart below shows that since 2003-04:
- For those survey respondents where the reference person was aged under 34, the proportion of households with debt is little changed; and
- For respondents older than 55, the proportion has risen significantly.
This is consistent with the common view that younger adults are finding it increasingly difficult to purchase a first home, at least partly because they are being outbid by baby boomers purchasing investment properties.
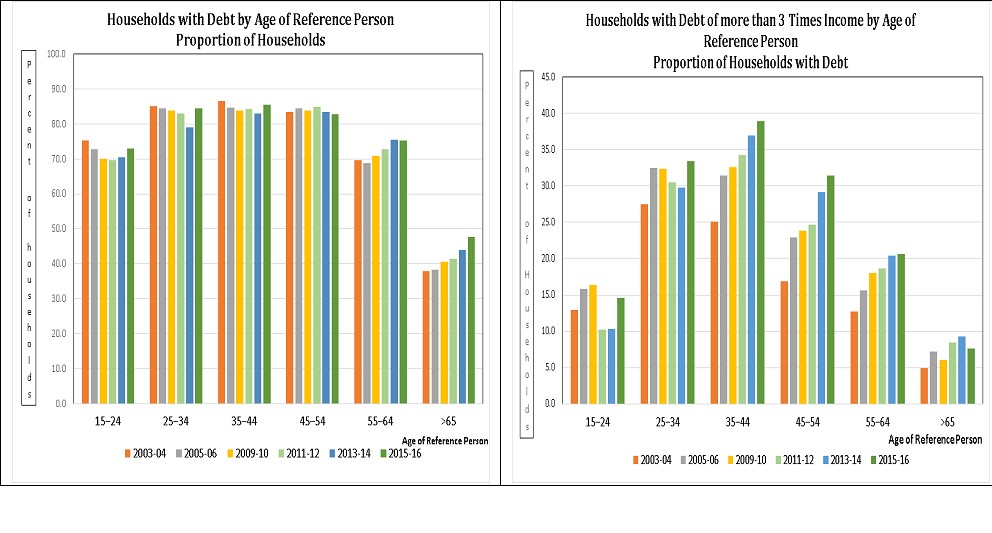
But for us, the most worrying debt trend is revealed in the right hand side chart above. It shows, by age of reference person, the percentage of households with debt of more than three times income. While rising for all those aged over 25 since 2003-04, the most disturbing aspect is that in 2015-16 it was 20.6% for those aged 55-64 and 7.6% for those aged over 65, compared with 12.7% and 4.9%, respectively, in 2003-04.
Few of the over 55’s would be able to repay debt that is in excess of three times income from savings alone. Lenders are therefore heavily reliant on sale of assets to repay the borrowing. As we have suggested previously, this is not good banking practice. It also has worrying implications for the retirement plans of many baby boomers should supporting asset prices fall heavily.
Increased household wealth not an unambiguous positive
The net worth of the average Australian household has grown at a real rate of 4.2% p.a. over the four years from 2011-12 to 2015-16 – at this rate, real wealth doubles about every 17 years. It has been fuelled by strong growth in the values of both financial (6.4% p.a.) and non-financial assets (3.3% p.a.), particularly residential property. It has also at least been partly facilitated by a large increase in liabilities (4.6% p.a.).
These growth rates are well in excess of the underlying growth of the economy over this period (GDP of 2.6% p.a.) and may have even increased over the two years since the 2015-16 survey was conducted. It’s hard to resist the conclusion that the desire to share in these gains has caused many to become financially stretched, regardless of wealth. They would be very vulnerable should asset prices stall, or reverse, for any significant period.
[1] Released on 13 September 2017
