

Significant wealth rarer than marketers would have us believe
The Australian Bureau of Statistics recently released its bi-annual survey of Australian household income and wealth for 2013-14[1]. In January 2012, we used the results of the 2009-2010 survey to look at the financial health of Australians in two articles, “Household income and wealth in Australia” and “A high income does not imply high net worth”. A key conclusion was that even Australia’s wealthier households (i.e. as measured by the top quintile in terms of household wealth) are not well positioned for financial independence.
In this article, we use the 2013-14 survey data to provide an update of some of the income and wealth charts provided in those previous articles. We also examine the data on household debt and, given the way we think about things, conclude that some concerning trends that were evident in the 2009-10 survey have become even more concerning.
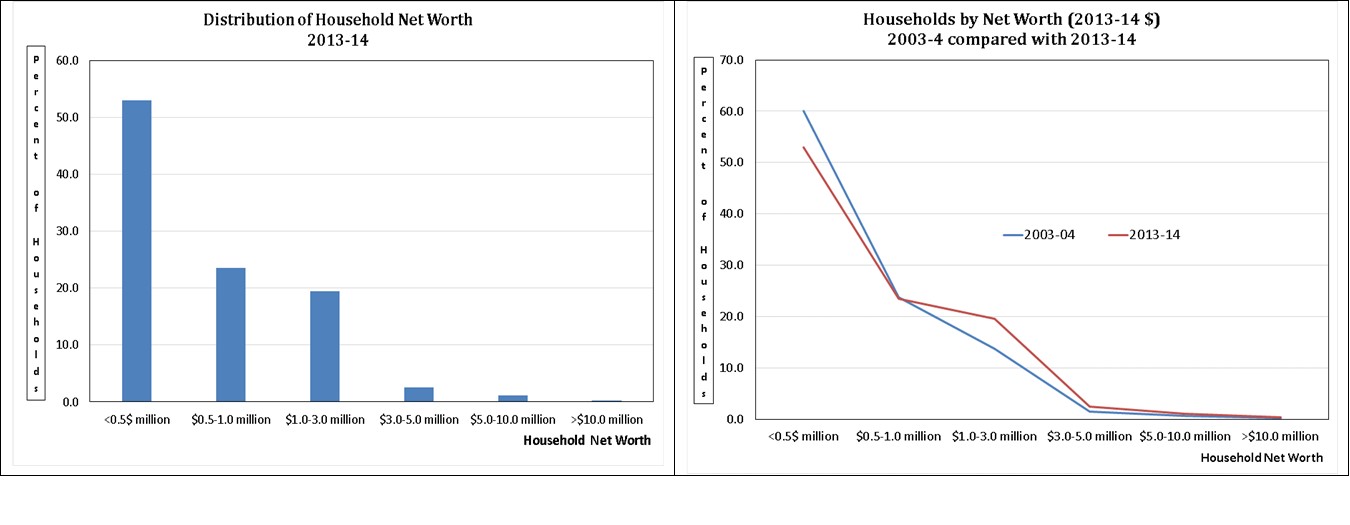
The first chart below shows the distribution of household wealth or net worth for 2013-14. It reveals that 96% of Australian households have net worth less than $3 million. Only 1.4% have wealth in excess of $5 million. Our observation from 2012 remains true:
“We suspect avid consumers of financial and lifestyle media would be surprised by these findings. Significant wealth is much rarer that the marketers would have us believe.”

The chart on the right hand side above shows how household wealth has changed over the 10 years since 2003-04. There has been a sizable move from the under $1.0 million to the $1.0-$3.0 million category but not much change in the percentage of households with wealth in excess of $5.0 million.
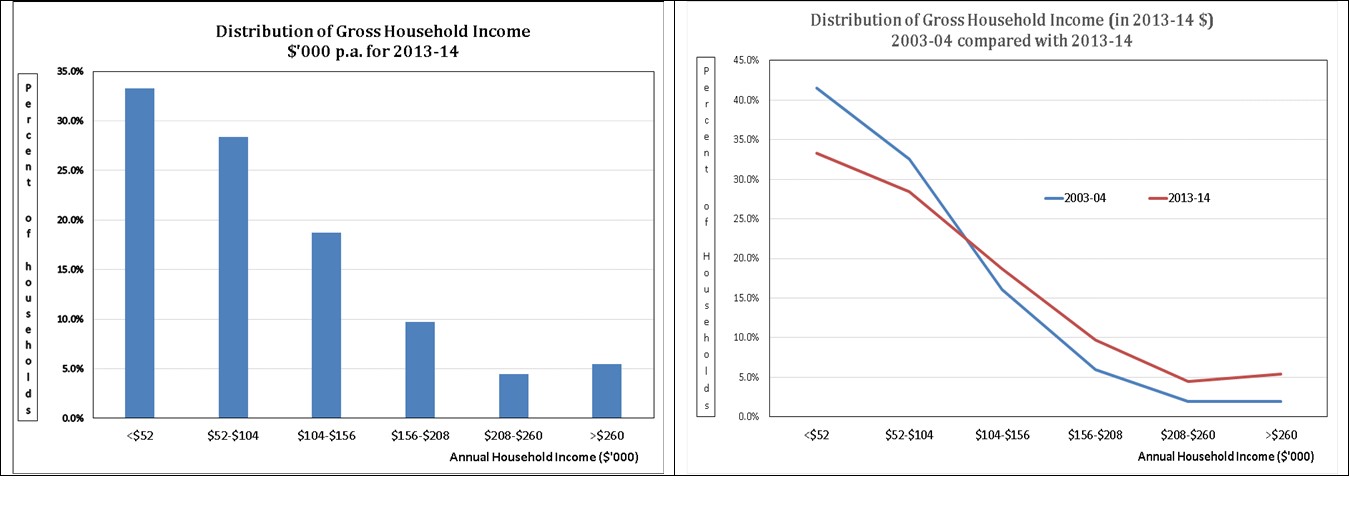
The charts below examine the distribution of household income for 2013-14 and the change in that distribution over the past 10 years (in 2013-14 dollars).

It is interesting to note that while the percentage of households with disposable income in excess of $156,000 p.a. has almost doubled over the 10 years to 2013-14, from 10% to 19.6%, the earlier household wealth charts reveal that these higher incomes have not yet resulted in a commensurate change in the percentage of households with wealth in excess of $5 million. The Global Financial Crisis is one obvious explanatory factor.
Baby boomers taking more debt risk
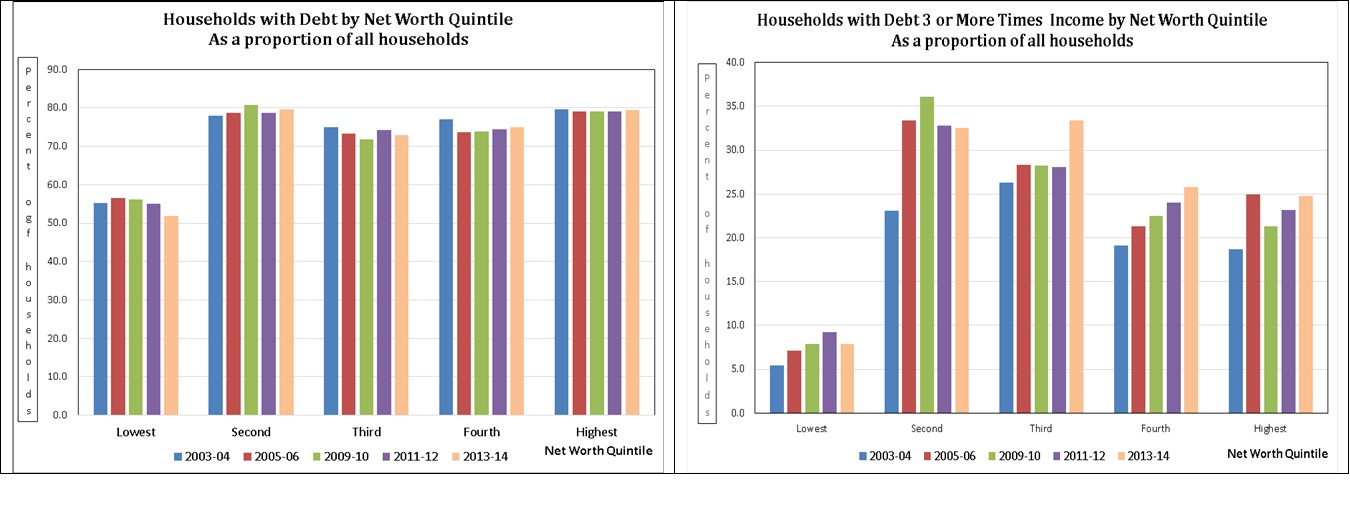
As mentioned above, some of the debt trends revealed by the surveys are concerning. The left hand chart below looks at how the proportion of “households with debt” has changed for each net worth quintile for the five surveys conducted since 2003-04 (survey not completed in 2007-08). It suggests nothing untoward, with debt holders remaining relatively stable across all quintiles.

However, when the criteria is “Debt 3 or more times income”, the right hand chart reveals that across all net worth quintiles the relevant proportion of households has risen dramatically over the ten years since 2003-04. Across all households, those with debt of 3 or more times income has risen from 19.3% to 26.0%.
This probably reflects both rising house prices, requiring increased loan sizes, and an increased willingness to borrow to purchase investment properties. Our view is that once debt to income ratios rise too much beyond three, it becomes increasingly hard to both repay the debt and accumulate sufficient wealth for financial independence.
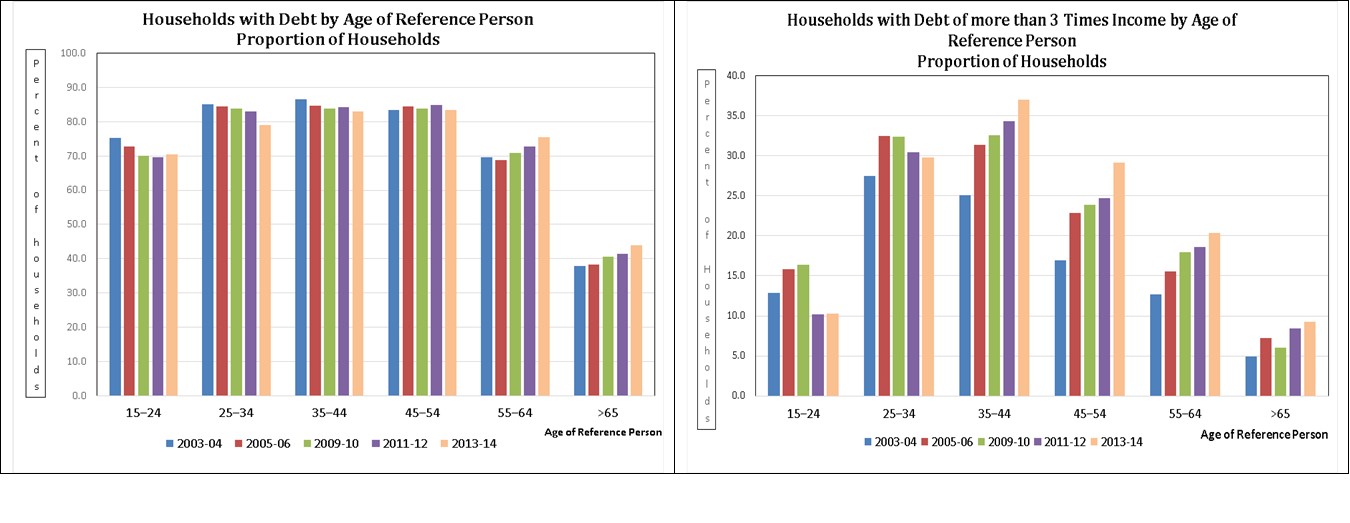
But the real concern for us arises when the debt data is examined based on the age of the reference person that responded to the surveys. The left hand chart below shows that since 2003-04:
- For those survey respondents where the reference person was aged under 34, the proportion of households with debt has fallen; and
- For respondents older than 55, the proportion has risen.
This is consistent with the common view that younger adults are finding it increasingly difficult to purchase a first home because they are being outbid by baby boomers purchasing investment properties.

But for us, the most potentially alarming debt trend is revealed in the right hand side chart above. It shows, by age of reference person, the percentage of households with debt of more than three times income. While rising dramatically for all those aged over 35, the most disturbing aspect is that in 2013-14 it was 20.4% for those aged 55-64 and 9.3% for those aged over 65.
It is most unlikely that anyone aged over 55 would be able to repay debt that is in excess of three times income from savings alone. The lender is therefore heavily reliant on sale of assets to repay the borrowing. As we have suggested previously, this is not good banking practice. It also has worrying implications for the retirement plans of many baby boomers should supporting asset prices fall heavily.
Debt is a two edged sword
Averages hide a lot of information. But the survey data indicate that increasing proportions of households have exposed themselves to worrying levels of debt in a bid to accelerate their wealth accumulation. It can only be hoped that they have taken adequate account of the fact that debt is a two edged sword.
