
| Your capacity for investment risk is not age dependent In helping our clients determine an appropriate asset allocation target, we attempt to assess:
|  |
In this article, we explore the concept of “capacity for risk” in more depth. Most people, including most financial planners, tend to correlate capacity for risk with age. It’s based on the premise that the older you are the less time you have to recover from poor investment markets, implying the need for more defensive investment portfolios.
Our view is that age is not the primary indicator of your capacity for investment risk. Rather, it is how much you expect to add to or drawdown on your existing investment wealth. Age may be irrelevant.
Expected future savings drive investment risk capacity
To make the discussion clearer, let’s consider three 45 year olds, John, James and Jeff. All are currently spending $160,000 p.a. in today’s dollars and wish to do so for the rest of their lives. They all intend to retire at age 65 with a balanced 50% defensive assets / 50% growth assets investment portfolio. But their current future savings and net investment wealth positions are significantly different:
- John currently has no net investment wealth but expects to be able to save an average of $192,500 p.a. (in today’s dollars) for the next 20 years to age 65. His expected future savings of $3.85 million are therefore equal to what we call his projected lifetime investment wealth (i.e. his wealth at age 65, assuming after-inflation investment returns are zero);
- James does not expect to save anything from earnings over the next 20 years i.e. his future savings are estimated at zero. But he currently has net investment wealth of $2.7 million, equally split between defensive and growth assets; and
- Jeff is doing voluntary work and drawing down on existing net investment wealth to fund his spending of $160,000 p.a.. His future expected savings to retirement are therefore actually negative, to the tune of $3.2 million over the next 20 years. He hopes his current net investment wealth of $4.0 million, also equally split between defensive and growth assets, will enable him to meet his desired lifetime spending.
The table below summarises the above information:
| 45 – Year Old | (1) Future Savings ($m) | (2) Net Investment Wealth ($m) | (3)=(1)+(2) Projected Lifetime Investment Wealth ($m) | (4)=(1)/(3) Risk Capacity (%) |
| John | 3.85 | 0.0 | 3.85 | 100 |
| James | 0.0 | 2.7 | 2.7 | 0 |
| Jeff | -3.2 | 4.0 | 0.8 | -400 |
The “Risk Capacity” measure shown as Column (4) of the table is simply future savings divided by Projected Lifetime Investment Wealth. As we’ll demonstrate graphically below, the more positive the number, the greater the assessed investment risk capacity. John’s assessed risk capacity is high, James’ is zero and Jeff’s is very low, yet they are all the same age.
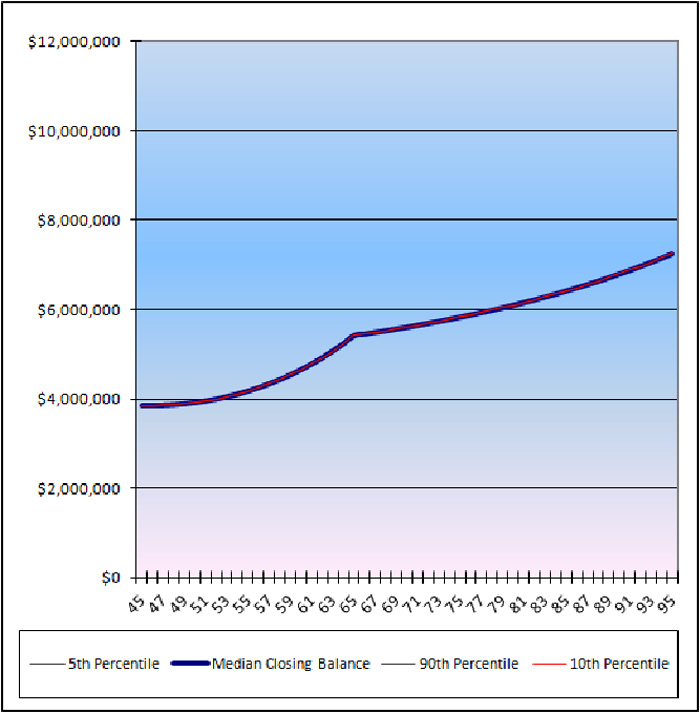
All the figures discussed above have been carefully chosen. Based on some reasonable assumptions [1.] regarding investment returns for defensive and growth assets, and assuming those returns do not change from year to year (i.e. no investment return volatility), the figures result in essentially the same long term wealth projections beyond age 65 for each of our 45 year olds, as shown in the charts below:
John
James

Jeff

There is no indication from this analysis that there are any shortcomings in our 45 year olds’ planning. But it totally ignores the impact of investment return volatility. When we assume typical investment return volatilities of 3% p.a. and 14% p.a. for defensive and growth asset returns, respectively, the wealth possibilities look very different.
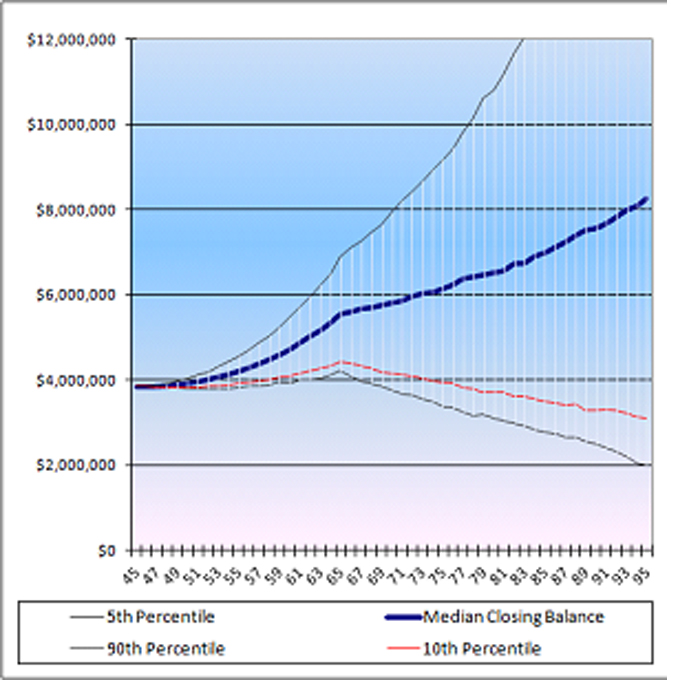
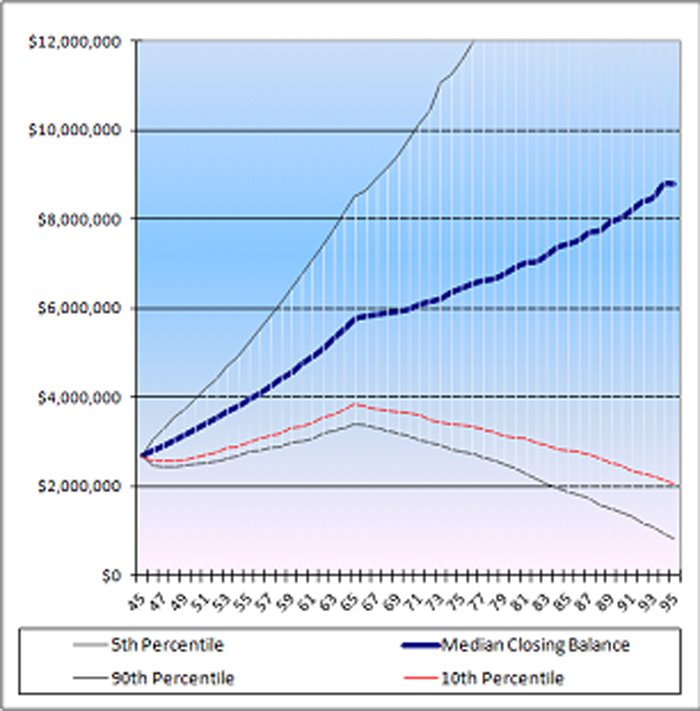
Using a technique called Monte Carlo analysis, we are able to simulate thousands of potential wealth paths, based on generating series of random investment returns using the assumed investment returns and volatilities. The results of those simulations for John, James and Jeff are shown below:
Projected Investment Wealth
Range of Variation
John
James
Jeff
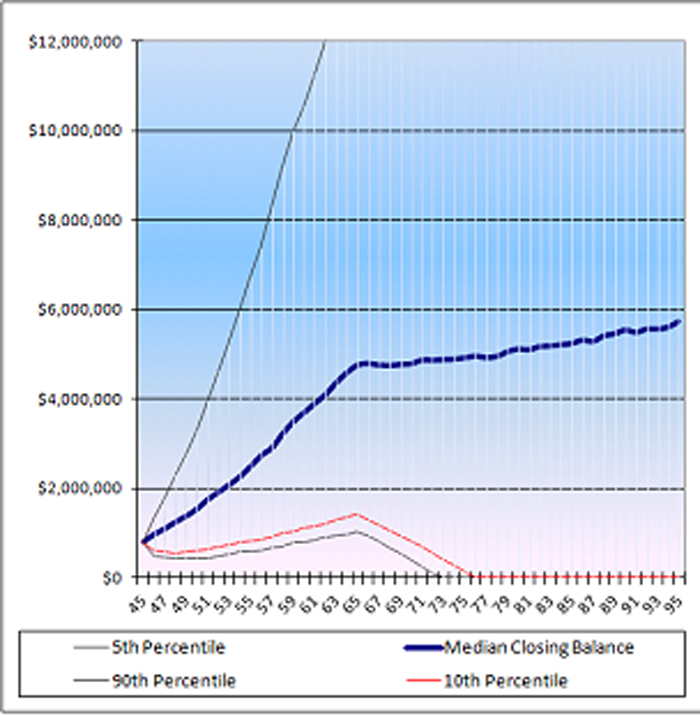
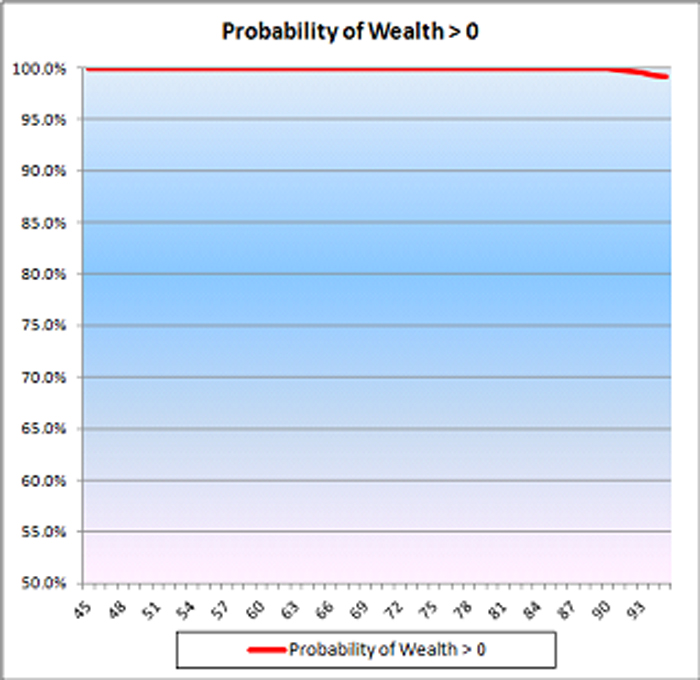
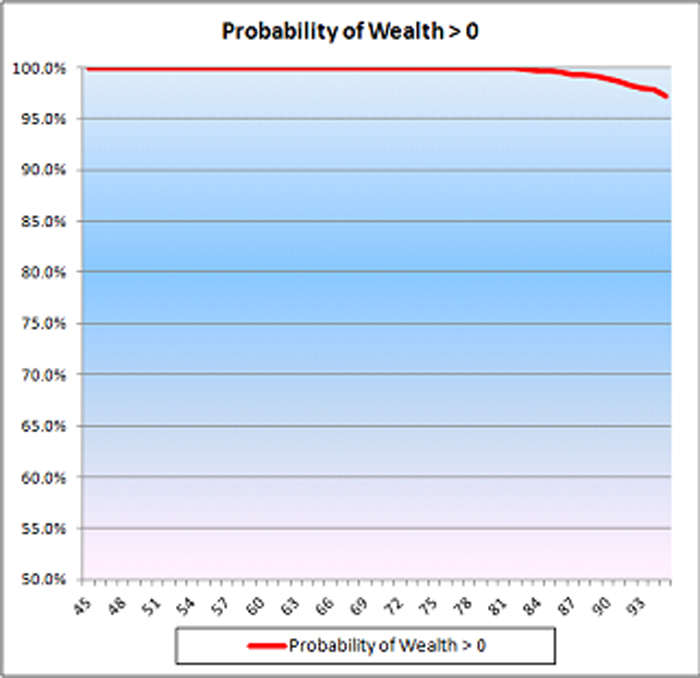
It is clear that the range of potential wealth outcomes is much larger for Jeff than John. And, as shown below, the chances of “running out of money” are very much higher for Jeff than John.
Probability of Positive Investment Wealth
John
James
Jeff
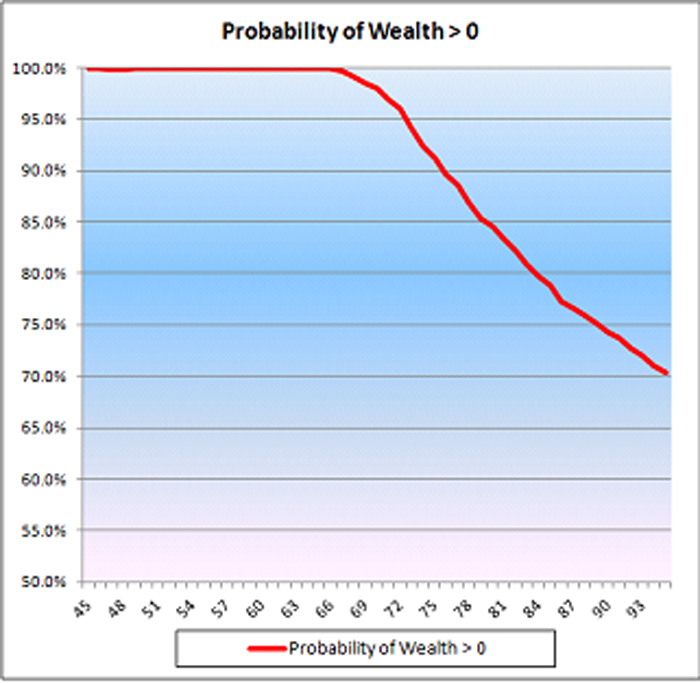
John is able to cope with sustained periods of poor investment returns (represented by the 5th percentile) as he is continually investing from age 45 to age 65 and would be buying at relatively low prices. Jeff, however, is constantly drawing on investment capital over this period and would be selling at those prices, eroding his wealth. In summary, Jeff’s investment risk capacity is non-existent and his plan has an undesirably high chance of failure.
Asset allocation should consider future savings
So, as illustrated above, “investment risk capacity” is not a function of age but dependent on the extent to which you expect to add to or draw down on your current net investment wealth. If you’re aged 65, and expect to save from earned income over the next ten years, your risk capacity may be higher than that of a 50 year old who is drawing on net investment wealth to fund lifestyle spending.
This view of investment risk capacity suggests that any attempt to choose an appropriate asset allocation without first considering expected future savings (or future capital) is fundamentally flawed. You may be taking on more or less investment risk than is consistent with giving you the best chance of achieving your lifestyle objectives.
[1.] Return on defensive assets of 1% p.a. after-inflation; return on growth assets of 6% p.a. after inflation.

