
How is Australia’s spending on housing measured?
For those who own their own home and don’t have a mortgage their sense is often that other than for costs like council rates, utilities, building insurance and maintenance they don’t spend anything on housing. For those with a mortgage, they may add in the cost of their loan repayments.
But this is not the way the Australian Bureau of Statistics (“ABS”) looks at things in its National Accounts’ publications. When calculating how much we, as a nation, spend on housing services the ABS effectively looks at what the entire housing stock could be rented for, based on current rental rates.
So both renters and homeowners are treated equivalently. What renters spend on housing is actually the market rent they pay, while homeowners have a rent “imputed” to them to calculate their housing spend.
Spending on rates, insurance, real estate fees and maintenance are not regarded as components of household consumption expenditure. Rather, they are costs of earning rental income, either actual or imputed, of property owners.
The ABS calls the net rental figure “Gross operating surplus – dwellings owned by persons”. It is part of total gross household income and will be referred to as “Dwellings Net Income” in the rest of this article.
The ABS logic is compelling. Rather than living in their residences, homeowners could rent them to third parties to earn income to spend on other forms of consumption. The fact that they choose not to indicates that the imputed rental value of their residences is the amount of “dwelling services” they are happy consuming.
Our spending on housing continues to increase
ABS data [1.] reveals that our spending on housing services as a percentage of total household spending has risen dramatically over the period from June 1960 to June 2012. This is shown in the chart below.
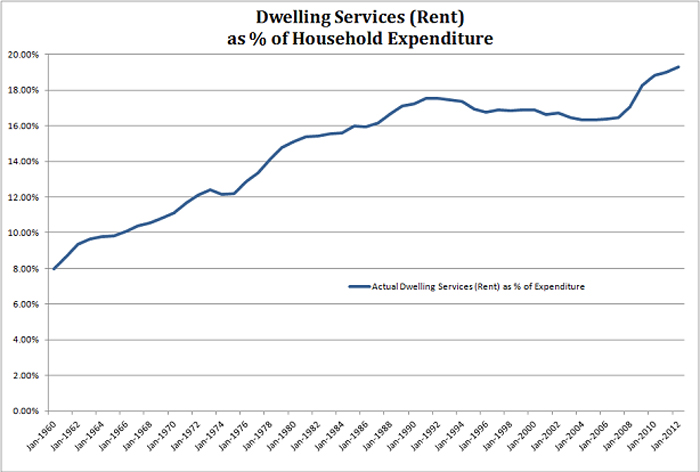
As at June 2012 we were allocating 19.3% of our spending to housing services (excluding water and sewerage), compared with only 8.0% as at June 1960. This is a huge shift in Australian’s consumption preferences.
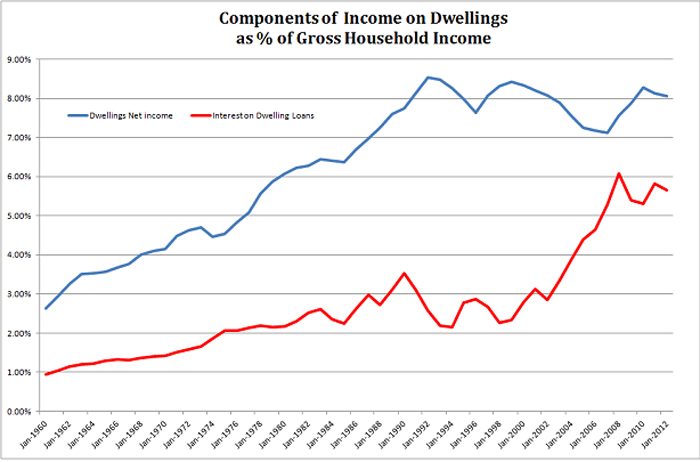
Corresponding with the increased spending on housing services, Dwellings Net Income as a share of gross household income rose from 2.6% at June 1960 to 8.1% at June 2012, as shown by the blue line in the following chart.
So, what does it matter that more of our spending is being allocated to housing. Particularly since it means more of household income is being derived from our dwellings.
A major issue is evident in the chart above. While Dwellings Net Income has risen as a share of household income, it has flattened since June 2000. And over the 12 years to June 2012, it was increasingly offset by a more than doubling of interest costs on dwelling loans (the red line).
Rising interest payments on dwellings reflects higher housing values and the consequent increased size of housing loans required to purchase our more expensive houses. It also undoubtedly reflects borrowing against the rising value of the dwelling stock to finance other forms of consumption and/or investments.
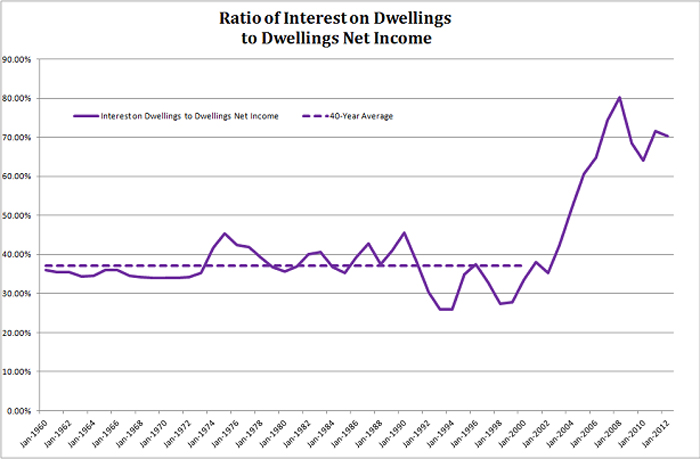
The following chart, that is simply the ratio of interest payments on Dwelling Loans to Dwellings Net Income (i.e. the red line in the chart above divided by the blue line), reveals more clearly the significant change that has occurred since the early 2000’s. Compared with a 40 year average to June 2000 of about 37%, interest payments were around 70% of Dwellings Net Income at June 2012.
In summary, as a nation, we have dramatically increased borrowings secured against the stock of housing to finance both increased expenditure on housing and other consumption (and investments). This has occurred over a period when net rentals from housing (as a percentage of household income) have been flat.
Housing spending and borrowing are in unchartered territory
Although recent experience may be a “new normal”, we suspect it reflects imbalances produced by the early-mid 2000’s property euphoria that will require some potentially painful unwinding. For the Interest Payments on Dwelling Loans to Dwellings Net Income ratio to return to the long run average, one or a combination of the following have to occur:
- Net rent (as a share of income) needs to rise, implying further increases in expenditure on housing services and/or reductions in property holding costs. The capacity for this to occur is questionable, given the already high expenditure on housing services;
- Further reductions in interest rates to reduce interest costs – the concern with this “solution” is that it may lead to increased housing related borrowing that offsets the lower interest rate effect; and
- A reduction in housing related borrowings – an unwinding of debt may have adverse implications for both house prices and for consumption.
Although we don’t know how things will pan out, it is evident that Australian households are in unchartered territory with regard to both the amount of housing services they consume and the amount they have borrowed based on the value of the housing stock. This suggests to us that a decision to proactively add to your residential property holdings, either for lifestyle or investment purposes, carries greater financial risk than is generally appreciated.
[1.] ABS Australian System of National Accounts, 5204.0, 2011-12
1 Comment. Leave new
I agree with the added risk that purchasing a property entails. Most Australians see property as a solid investment over the longer-term that they can (at least) live in, even if the value goes down. Most wouldn’t see the benefits of share and managed fund investing unless they analysed the sale difference of their homes against investment data at the date of sale.