
You need to know your current asset allocation
 In our last article, “Choosing your target asset allocation”, we discussed the key determinants of the choice of your target asset allocation. But in developing an investment strategy designed to reach your target by retirement it is essential to have a meaningful measure of your current asset allocation.
For those who expect to continue to accumulate wealth from business or employment earnings, the traditional ways of measuring asset allocation are not very helpful. A better approach to asset allocation takes advantage of our “Projected Lifetime Investment Wealth” framework. It takes a much broader view of wealth and provides valuable insights relevant to answering many typical personal finance questions e.g. how much could or should I borrow, how should I build my risky growth asset exposure over time, can I afford a larger home.
To illustrate our approach, let’s consider Stephen, a 40 year medical specialist who wishes to retire at age 65. His family’s current balance sheet is shown below:
Assets | ($’000) | Liabilities | ($’000) |
Residence (L*) | 2,500 | Mortgage | 1,000 |
Cars, Furniture (L) | 200 | ||
Bank Accounts (D**) | 50 | ||
Practice Rooms (G***) | 400 | Investment Loan | 200 |
Superannuation: – Defensive Assets (D) – Growth Assets (G) |
200 200 | ||
Shares (G) | 150 | ||
Total Assets | 3,700 | Total Liabilities | 1,200 |
NET WORTH | 2,500 |
|
|
*L=Lifestyle Assets, **D= Defensive Investment Assets, ***G= Growth Investment Assets
Stephen and his family have a net worth of $2.5 million. But what is their current investment asset allocation?
An asset allocation hierarchy
A first consideration when measuring asset allocation is whether to include lifestyle assets (e.g. residence, cars etc) in the analysis. Stephen has made it clear that he never wants to be in a position to sell lifestyle assets to fund living expenses. Accordingly, they are ignored as investment assets.
The basic and most common way of measuring asset allocation is to look only at investment assets. The table below shows Stephen’s asset allocation on this basis.
| Asset Based ($’000) | % |
|
|
|
|
Defensive | 250 | 25.0 | ||||
Growth | 750 | 75.0 | ||||
Total | 1,000 | 100.0 |
A reasonably high growth position of 75.0% is suggested. The conventional view would be that this is not inappropriate given his relatively young age and 25 year earning expectation.
However, the total investment assets of $1.0 million are not a measure of the funds available to Stephen and his family to live off if Stephen is no longer working. They must be reduced by outstanding debt. Borrowings are, effectively, a negative defensive asset.
We call the difference between investment assets and borrowings “Net Investment Wealth”. Its importance is discussed in our Blog article, “How far to financial freedom”. The calculation of Stephen’s Net Investment Wealth (“NIW”) is shown below:
| Asset Based ($’000) | % | Net Investment Wealth (“NIW”) ($’000) | % |
|
|
Defensive | 250 | 25.0 | -950 | n.a. | ||
Growth | 750 | 75.0 | 750 | n.a. | ||
Total | 1,000 | 100.0 | -200 | n.a. |
A negative NIW implies that all of Stephen’s net worth is tied up in lifestyle assets. Remember, the current residence is never to be used to fund living expenses. On this basis, Stephen has not even started accumulating for retirement!
But we also don’t think NIW is a true reflection of Stephen’s total investment wealth for asset allocation purposes. Based on well considered cash flow projections, Stephen expects to be able to save (and invest) at least $3.75 million in today’s dollars between now and his age 65, or an average of $150,000 p.a.
This “Projected Surplus Capital” (or “Future Capital”) is, in our view, as much a part of Stephen’s wealth as conventional investments like cash, shares and property. Until actually saved and invested, we regard it as a defensive asset (after appropriate adjustments for various uncertainties). On this basis, total defensive assets are now $2.8 million i.e. projected surplus capital of $3.75 million plus actual net defensive assets of -$0.95million.
The chart below shows the allocation of Stephen’s “Projected Lifetime Investment Wealth”, that includes future capital:
Asset Based ($’000) | % | Net Investment Wealth ($’000) | % | Projected Lifetime Investment Wealth($’000) | % | |
Defensive | 250 | 25.0 | -950 | n.a. | 2,800 | 78.9 |
Growth | 750 | 75.0 | 750 | n.a. | 750 | 21.1 |
Total | 1,000 | 100.0 | -200 | n.a. | 3,550 | 100.0 |
It reveals that Stephen’s current asset allocation is 79% Defensive / 21% Growth, an apparently fairly defensive position. It suggests an entirely different view of his risk exposure than the simplistic “Asset Based” asset allocation measure.
The Projected Lifetime Investment Wealth approach puts the level of Stephen’s current growth asset holdings into context. While they may appear large relative to his current investment assets, when compared with the funds expected to be available for investment in the future they are modest .
Projected Lifetime Investment Wealth drives your investment strategy
It is this asset allocation based on Projected Lifetime Investment Wealth that needs to be compared with Stephen’s target asset allocation (i.e. the mix between defensive and growth assets that Stephen will be comfortable holding when he is no longer working) when formulating an appropriate investment strategy.
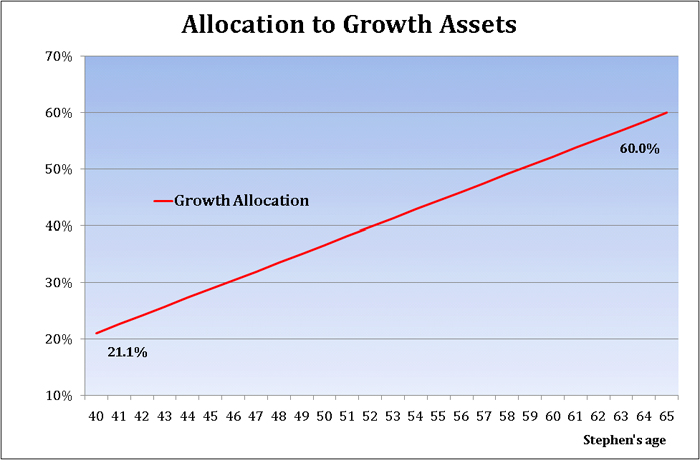
If we assume that Stephen’s target asset allocation is 40% Defensive / 60% Growth, the chart below reveals the discrepancy between his current growth asset allocation (of 21.1%) and the target growth asset allocation target (of 60%).
Stephen’s investment strategy should focus on how he wants to transition from his current growth asset allocation to the target growth asset allocation over the next twenty five years. The issue of transition is the subject of our next article.
Our “Understanding Asset Allocation” series of articles is now available as a free eBook. Download here now.


1 Comment. Leave new
[…] previous article, “Measuring your current asset allocation”, explained how we believe wealth accumulators (those whose after-tax earnings exceed their […]